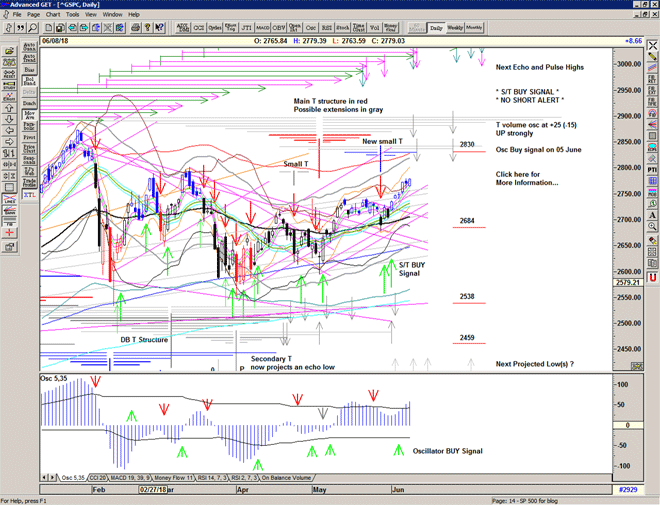
Like a crime

All of this is mine
All of this is mine (this is mine)
Want it like a crime (this is mine)
Give these lips of mine (this is mine)

PJ Harvey, This is Mine

(From the soundtrack of Stella Does Tricks, 1996, Dir. Coky Giedroyc)

The market drops out of the gate and spends the day looking at 2700, back-filling, perhaps threatening to move lower, but holding up above the current support and Buy Signal level, for now.

A pulse high and another projection for a high today from the DB T structure, perhaps an attempt to fill yesterday's gap.

Chart of S&P 500 for 16 May 2018

Be prepared for whatever is coming next, and trade with confidence:

To receive detailed daily analysis, guidance and the updated daily Buy / Sell trigger levels being generated by the Trading the Line system before the market opens, and intraday alerts when appropriate, please become a Member and Sign up for Alerts & Observations – includes access to Members Area and the Explanatory Notes for all of the concepts discussed.

Disclaimer: This is the diary of a personal trading system, its methodology and the signals that it is producing. You are welcome to follow along but please understand that the information presented here is for educational purposes only. No recommendations are being made to buy, or sell stocks, options or futures contracts. Please consult your own financial advisor before making any investment decisions.


Mercuralia

A gap up open and a visit to the 2742 level initiates a gradual decline in-line with the new T structure's projection for a high. Further consolidation and a pause may be necessary to let off some of the pressure from the rapid move off the recent low.

Chart of S&P 500 for 15 May 2018

Be prepared for whatever is coming next, and trade with confidence:

To receive detailed daily analysis, guidance and the updated daily Buy / Sell trigger levels being generated by the Trading the Line system before the market opens, and intraday alerts when appropriate, please become a Member and Sign up for Alerts & Observations – includes access to Members Area and the Explanatory Notes for all of the concepts discussed.

Disclaimer: This is the diary of a personal trading system, its methodology and the signals that it is producing. You are welcome to follow along but please understand that the information presented here is for educational purposes only. No recommendations are being made to buy, or sell stocks, options or futures contracts. Please consult your own financial advisor before making any investment decisions.


Nova Roma

Another impressive move upwards through the previous high and potentially out of the declining resistance.

Market now displaying some similar characteristics as at the previous recent highs – overbought and perhaps over-stretched and very low put/call ratios – but also showing some bullish divergences with those highs.

An echo high is scheduled for today, and the new T structure projects into early and late next week. The volume oscillator indicates strong breadth and supports the projections for highs with the increasing possibility that the new T structure is larger than currently drawn.

This is looking more and more like a recovery – how the market performs at the next pullback (whenever that occurs) will be revealing.

Chart of S&P 500 for 11 May 2018

Be prepared for whatever is coming next, and trade with confidence:

To receive detailed daily analysis, guidance and the updated daily Buy / Sell trigger levels being generated by the Trading the Line system before the market opens, and intraday alerts when appropriate, please become a Member and Sign up for Alerts & Observations – includes access to Members Area and the Explanatory Notes for all of the concepts discussed.

Disclaimer: This is the diary of a personal trading system, its methodology and the signals that it is producing. You are welcome to follow along but please understand that the information presented here is for educational purposes only. No recommendations are being made to buy, or sell stocks, options or futures contracts. Please consult your own financial advisor before making any investment decisions.


Jerusalem

What is Above is Within … the Circumference is Within, Without is formed the Selfish Center, and the Circumference still expands going forward to Eternity.

William Blake, Jerusalem: The Emanation of the Giant Albion, 1804

An impressive move upwards above the important pivot, and into the upper area of the recent triangulation as the market challenges recent resistance.

Chart of S&P 500 for 10 May 2018

Be prepared for whatever is coming next, and trade with confidence:

To receive detailed daily analysis, guidance and the updated daily Buy / Sell trigger levels being generated by the Trading the Line system before the market opens, and intraday alerts when appropriate, please become a Member and Sign up for Alerts & Observations – includes access to Members Area and the Explanatory Notes for all of the concepts discussed.

Disclaimer: This is the diary of a personal trading system, its methodology and the signals that it is producing. You are welcome to follow along but please understand that the information presented here is for educational purposes only. No recommendations are being made to buy, or sell stocks, options or futures contracts. Please consult your own financial advisor before making any investment decisions.


Liberation

A choppy and mostly downward day with a spike high at 2676 and a spike low at 2655, and a positive finish.

Market finding important support and working away at the pivot.

A weak Osc oscillator momentum Buy Signal.

Chart of S&P 500 for 09 May 2018

Be prepared for whatever is coming next, and trade with confidence:

To receive detailed daily analysis, guidance and the updated daily Buy / Sell trigger levels being generated by the Trading the Line system before the market opens, and intraday alerts when appropriate, please become a Member and Sign up for Alerts & Observations – includes access to Members Area and the Explanatory Notes for all of the concepts discussed.

Disclaimer: This is the diary of a personal trading system, its methodology and the signals that it is producing. You are welcome to follow along but please understand that the information presented here is for educational purposes only. No recommendations are being made to buy, or sell stocks, options or futures contracts. Please consult your own financial advisor before making any investment decisions.


Red Cross

A gap up and grind into the resistance of 2681-3, a flush down into 2665 and a bounce into the close.
Something for everyone.

Chart of S&P 500 for 08 May 2018

Be prepared for whatever is coming next, and trade with confidence:

To receive detailed daily analysis, guidance and the updated daily Buy / Sell trigger levels being generated by the Trading the Line system before the market opens, and intraday alerts when appropriate, please become a Member and Sign up for Alerts & Observations – includes access to Members Area and the Explanatory Notes for all of the concepts discussed.

Disclaimer: This is the diary of a personal trading system, its methodology and the signals that it is producing. You are welcome to follow along but please understand that the information presented here is for educational purposes only. No recommendations are being made to buy, or sell stocks, options or futures contracts. Please consult your own financial advisor before making any investment decisions.


Hodie

Hodie
aperuit nobis
clausa porta
quod serpens in muliere
suffocavit,
unde lucet in aurora
flos de Virgine Maria.

Today
was opened unto us
a shut-up gate.
For the serpent drew it tight,
in woman choked –
yet from it gleams within the dawn
the Virgin Mary’s flower.

Hodio apercuit nobis, Psalm antiphon for the Virgin by Hildegard of Bingen, c. 1163-1175

An S/T Buy Signal at 2649 as the market takes another quick look at 2615 (the 200 day moving average) and moves rapidly higher.

A move up above the recent declining resistance line and (perhaps) a sign that the market is now able to move higher.

And with a very strong upward move in the T volume oscillator, it appears that a new T structure is emerging.

Chart of S&P 500 for 06 May 2018

Be prepared for whatever is coming next, and trade with confidence:

To receive detailed daily analysis, guidance and the updated daily Buy / Sell trigger levels being generated by the Trading the Line system before the market opens, and intraday alerts when appropriate, please become a Member and Sign up for Alerts & Observations – includes access to Members Area and the Explanatory Notes for all of the concepts discussed.

Disclaimer: This is the diary of a personal trading system, its methodology and the signals that it is producing. You are welcome to follow along but please understand that the information presented here is for educational purposes only. No recommendations are being made to buy, or sell stocks, options or futures contracts. Please consult your own financial advisor before making any investment decisions.


The Force

May the Force be with you

Star Wars, 1977, Dir: George Lucas

Another Sell Signal recovery as the market takes another look at the 200 day moving average.

S/T SELL Signal still active but position neutral, for now.

Chart of S&P 500 for 04 May 2018

Be prepared for whatever is coming next, and trade with confidence:

To receive detailed daily analysis, guidance and the updated daily Buy / Sell trigger levels being generated by the Trading the Line system before the market opens, and intraday alerts when appropriate, please become a Member and Sign up for Alerts & Observations – includes access to Members Area and the Explanatory Notes for all of the concepts discussed.

Disclaimer: This is the diary of a personal trading system, its methodology and the signals that it is producing. You are welcome to follow along but please understand that the information presented here is for educational purposes only. No recommendations are being made to buy, or sell stocks, options or futures contracts. Please consult your own financial advisor before making any investment decisions.


Solaris

Man has gone out to explore other worlds and other civilizations without having explored his own labyrinth of dark passages and secret chambers, and without finding what lies behind doorways that he himself has sealed.

Stanisław Lem, Solaris, 1961

Market rollsover after the FED announcement initiating a Sell Signal at 2650 in a similar reaction to the previous announcement on 21 March. Continuing the theme of declining resistance to price and selling of strength.

Chart of S&P 500 for 03 MAy 2018

Be prepared for whatever is coming next, and trade with confidence:

To receive detailed daily analysis, guidance and the updated daily Buy / Sell trigger levels being generated by the Trading the Line system before the market opens, and intraday alerts when appropriate, please become a Member and Sign up for Alerts & Observations – includes access to Members Area and the Explanatory Notes for all of the concepts discussed.

Disclaimer: This is the diary of a personal trading system, its methodology and the signals that it is producing. You are welcome to follow along but please understand that the information presented here is for educational purposes only. No recommendations are being made to buy, or sell stocks, options or futures contracts. Please consult your own financial advisor before making any investment decisions.