
Shrine
I made a shrine, I made it for you
I see you are an angel, all the things that you do
And now I found tomorrow, with you, I'm miles high
Shining like a diamond in the darkness of the sky
Ian Brown, Stellify, 2009
–
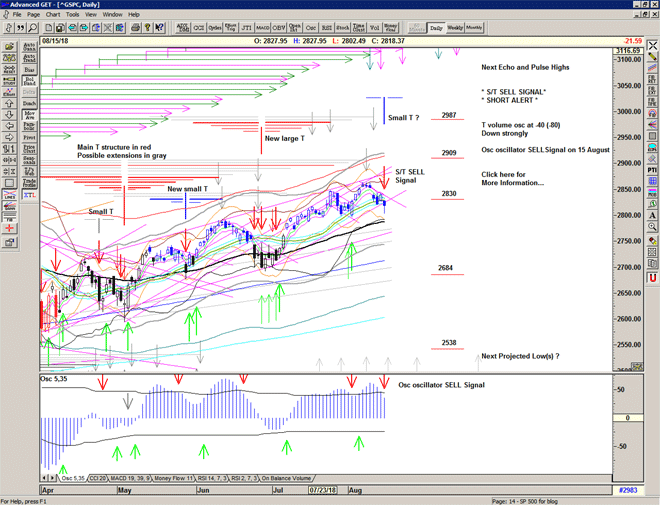
A Sell Signal below 2822, sees the market down in the low 2800's before finding some strength to end the day back near 2820.
Futures are up again this morning, exemplifying why not to hold short positions overnight.
Some indications of stabilisation in the T volume oscillator – a small T perhaps.

Be prepared for whatever is coming next, and trade with confidence:
To receive detailed daily analysis, guidance and the updated daily Buy / Sell trigger levels being generated by the Trading the Line system before the market opens, and intraday alerts when appropriate, please become a Member and Sign up for Alerts & Observations – includes access to Members Area and the Explanatory Notes for all of the concepts discussed.
Disclaimer: This is the diary of a personal trading system, its methodology and the signals that it is producing. You are welcome to follow along but please understand that the information presented here is for educational purposes only. No recommendations are being made to buy, or sell stocks, options or futures contracts. Please consult your own financial advisor before making any investment decisions.


