Bright horses

The bright horses have broken free from the fields
They are horses of love, their manes full of fire
They are parting the cities, those bright burning horses
And everyone is hiding, and no one makes a sound
And I'm by your side and I'm holding your hand
Bright horses of wonder springing from your burning hand

– Nick Cave and the Bad Seeds, Bright Horses, 2019

…

The market rips higher, cancelling Tuesday's Sell Signal at 2922 and triggering a new Buy Signal at 2936.

Back, again at the important 2950 pivot level.
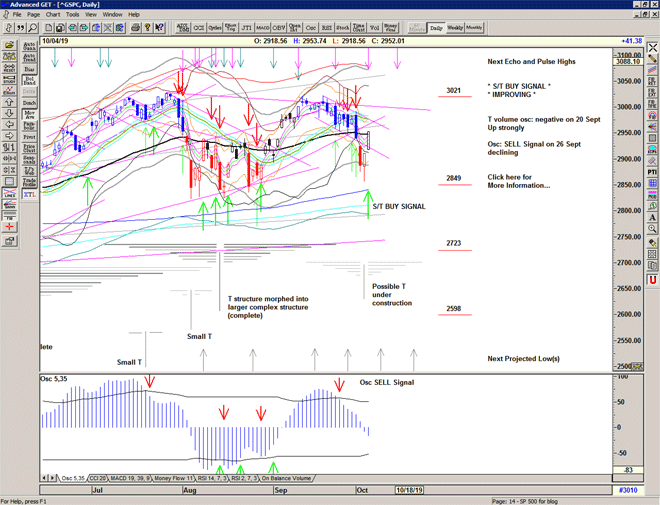
Chart of S&P 500 for 07 October 2019

To receive detailed daily analysis, guidance and the updated daily Buy / Sell trigger levels being generated by the Trading the Line system before the market opens, and intra-day alerts when appropriate, please become a Member and Sign up for Alerts & Observations – includes access to Members Area, Explanatory Notes (pdf) for all of the concepts discussed, and Notes on Day Trading (pdf)

Disclaimer: This is the diary of a personal trading system, its methodology and the signals that it is producing. You are welcome to follow along but please understand that the information presented here is for educational purposes only. No recommendations are being made to buy, or sell stocks, options or futures contracts. Please consult your own financial advisor before making any investment decisions.


Noble

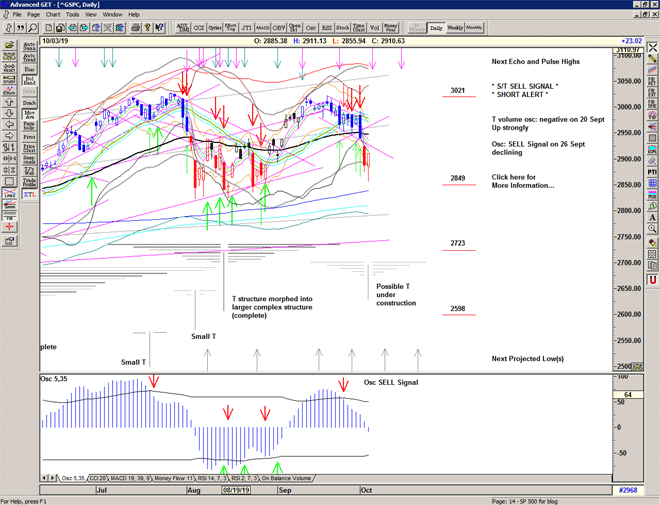
The market drops heavily to 2856 on economic news and is met with aggressive buying & short-covering leading to a close at the highs of the day.

Characteristic action at and below the lower edge of the gray channel.

The strong move up provides for the possibility of an impact low in place and a T under construction which may of course morph into a larger structure in due course.

Still below the Sell Signal level and further stabilization should be expected.

Chart of S&P 500 for 04 October 2019

To receive detailed daily analysis, guidance and the updated daily Buy / Sell trigger levels being generated by the Trading the Line system before the market opens, and intra-day alerts when appropriate, please become a Member and Sign up for Alerts & Observations – includes access to Members Area, Explanatory Notes (pdf) for all of the concepts discussed, and Notes on Day Trading (pdf)

Disclaimer: This is the diary of a personal trading system, its methodology and the signals that it is producing. You are welcome to follow along but please understand that the information presented here is for educational purposes only. No recommendations are being made to buy, or sell stocks, options or futures contracts. Please consult your own financial advisor before making any investment decisions.


Leiden

The Sell Signal continues with a drop at the open meeting further selling until ultimately finding some buying interest below the gray channel at 2975.

Certainly a possibility for some kind of attempt at recovery, but strong initial bounces from these type of sell offs are usually also sold into, as the market absorbs the impact of rapid price movement.

Sell Signal active.

Chart of S&P 500 for 03 October 2019

To receive detailed daily analysis, guidance and the updated daily Buy / Sell trigger levels being generated by the Trading the Line system before the market opens, and intra-day alerts when appropriate, please become a Member and Sign up for Alerts & Observations – includes access to Members Area, Explanatory Notes (pdf) for all of the concepts discussed, and Notes on Day Trading (pdf)

Disclaimer: This is the diary of a personal trading system, its methodology and the signals that it is producing. You are welcome to follow along but please understand that the information presented here is for educational purposes only. No recommendations are being made to buy, or sell stocks, options or futures contracts. Please consult your own financial advisor before making any investment decisions.


Twilight

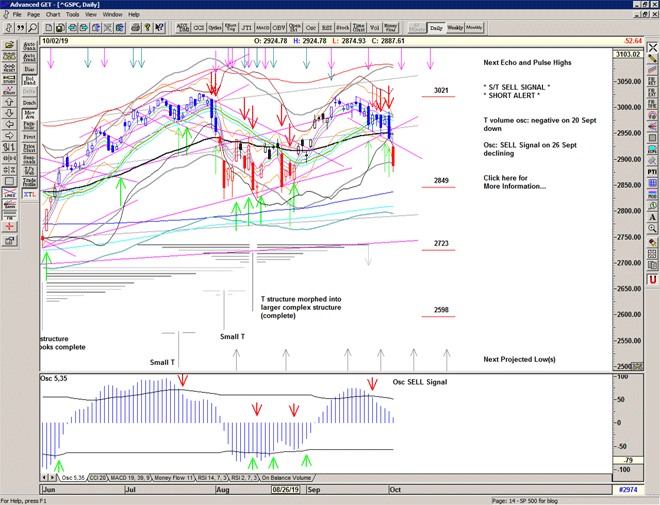
Another gap up into a Buy Signal followed by a heavy drop triggering an S/T Sell Signal at 2968 and selling continuing into the close.

Sell Signal active.

Chart of S&P 500 for 02 October 2019

To receive detailed daily analysis, guidance and the updated daily Buy / Sell trigger levels being generated by the Trading the Line system before the market opens, and intra-day alerts when appropriate, please become a Member and Sign up for Alerts & Observations – includes access to Members Area, Explanatory Notes (pdf) for all of the concepts discussed, and Notes on Day Trading (pdf)

Disclaimer: This is the diary of a personal trading system, its methodology and the signals that it is producing. You are welcome to follow along but please understand that the information presented here is for educational purposes only. No recommendations are being made to buy, or sell stocks, options or futures contracts. Please consult your own financial advisor before making any investment decisions.


Convene

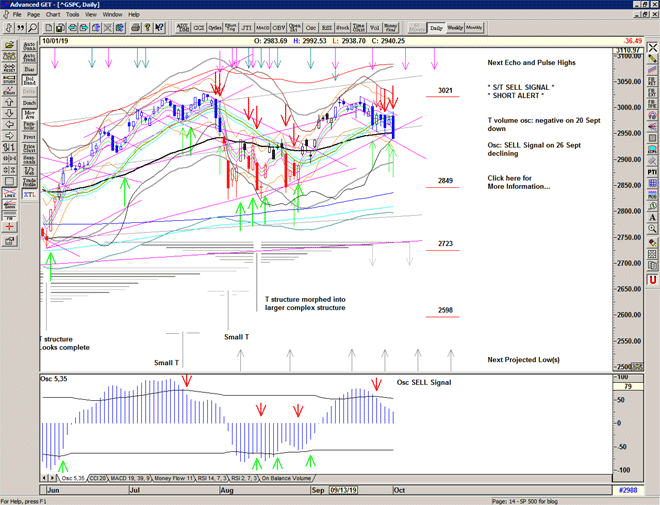
The market puts Thursday's negativity behind and pushes a little higher, triggering a Buy Signal at 2983 but no follow through and a slight drift lower does not confirm the signal.

Market still trapped within the converging channels.

Chart of S&P 500 for 01 October 2019

To receive detailed daily analysis, guidance and the updated daily Buy / Sell trigger levels being generated by the Trading the Line system before the market opens, and intra-day alerts when appropriate, please become a Member and Sign up for Alerts & Observations – includes access to Members Area, Explanatory Notes (pdf) for all of the concepts discussed, and Notes on Day Trading (pdf)

Disclaimer: This is the diary of a personal trading system, its methodology and the signals that it is producing. You are welcome to follow along but please understand that the information presented here is for educational purposes only. No recommendations are being made to buy, or sell stocks, options or futures contracts. Please consult your own financial advisor before making any investment decisions.


Flute

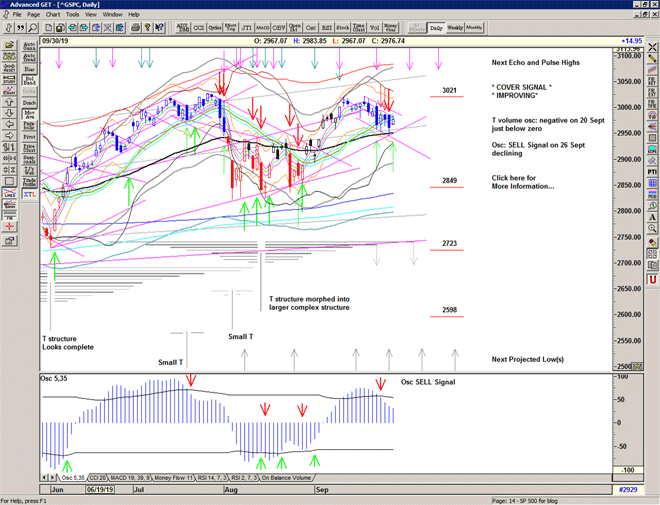
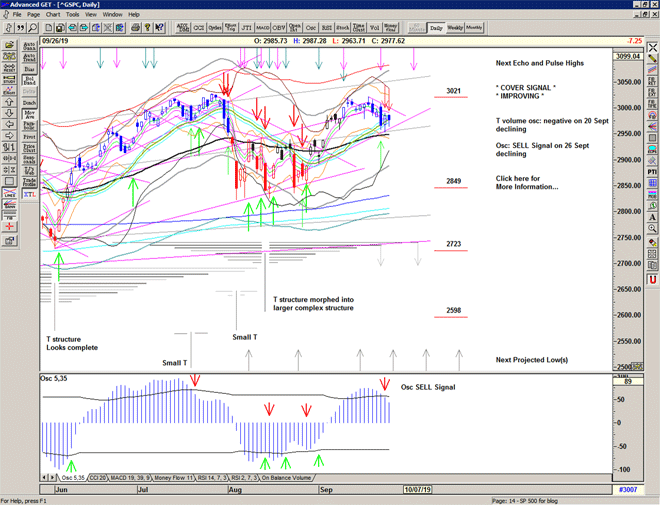
An S/T Sell Signal at 2971 sees a volatile move lower to 2945 and a look at the major pivot before recovering into the close.

Chart of S&P 500 for 30 September 2019

To receive detailed daily analysis, guidance and the updated daily Buy / Sell trigger levels being generated by the Trading the Line system before the market opens, and intra-day alerts when appropriate, please become a Member and Sign up for Alerts & Observations – includes access to Members Area, Explanatory Notes (pdf) for all of the concepts discussed, and Notes on Day Trading (pdf)

Disclaimer: This is the diary of a personal trading system, its methodology and the signals that it is producing. You are welcome to follow along but please understand that the information presented here is for educational purposes only. No recommendations are being made to buy, or sell stocks, options or futures contracts. Please consult your own financial advisor before making any investment decisions.


Maris

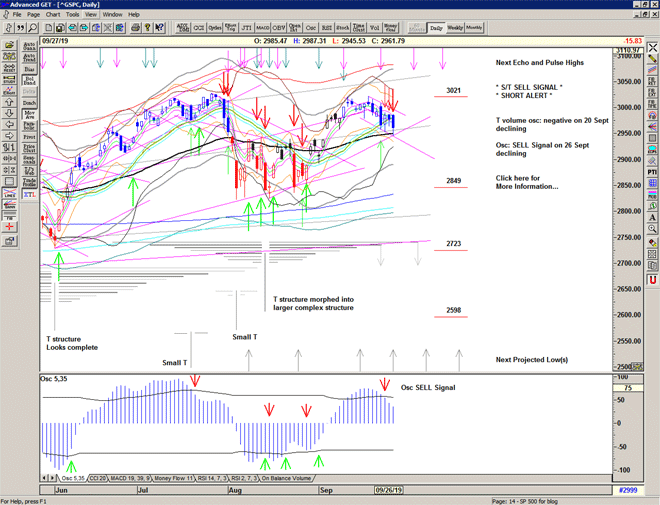
Another push down just below the Mid Channel triggering a Sell Signal briefly before quickly reversing back to the 2980s.

Again, selling from near the upper edge of the S/T channel and buying at the lower edge of the Mid Channel and starting to triangulate.

This is building energy for the next directional move.

Mixed signals with high Arms, rising Put/Call ratios adn price holding above key support levels whilst the oscillators are displaying weakness under the hood.

Chart of S&P 500 for 27 September 2019

To receive detailed daily analysis, guidance and the updated daily Buy / Sell trigger levels being generated by the Trading the Line system before the market opens, and intra-day alerts when appropriate, please become a Member and Sign up for Alerts & Observations – includes access to Members Area, Explanatory Notes (pdf) for all of the concepts discussed, and Notes on Day Trading (pdf)

Disclaimer: This is the diary of a personal trading system, its methodology and the signals that it is producing. You are welcome to follow along but please understand that the information presented here is for educational purposes only. No recommendations are being made to buy, or sell stocks, options or futures contracts. Please consult your own financial advisor before making any investment decisions.


Genetrix

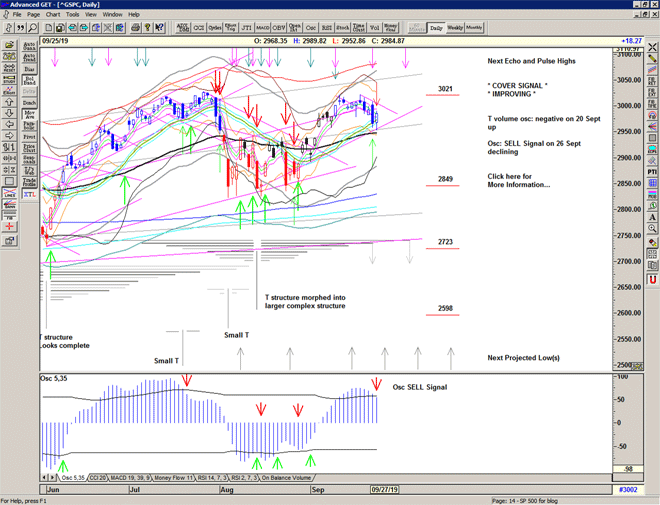
A quick look below 2960 triggers a Sell Signal briefly that is quickly cancelled as the market finds strong support and heads back into the channel.

A strong recovery from Tuesday selling but not quite enough for a Buy Signal, just yet.

Chart of S&P 500 for 26 September 2019

To receive detailed daily analysis, guidance and the updated daily Buy / Sell trigger levels being generated by the Trading the Line system before the market opens, and intra-day alerts when appropriate, please become a Member and Sign up for Alerts & Observations – includes access to Members Area, Explanatory Notes (pdf) for all of the concepts discussed, and Notes on Day Trading (pdf)

Disclaimer: This is the diary of a personal trading system, its methodology and the signals that it is producing. You are welcome to follow along but please understand that the information presented here is for educational purposes only. No recommendations are being made to buy, or sell stocks, options or futures contracts. Please consult your own financial advisor before making any investment decisions.


Finbarr

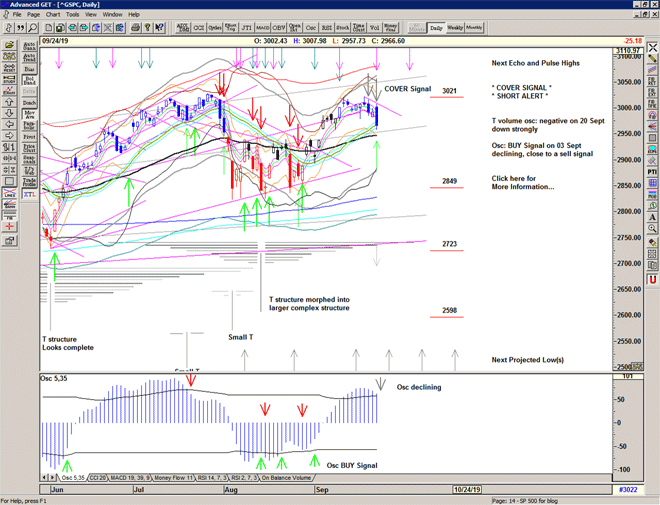
An attempted Buy Signal at 3004 is heavily sold into, through the Cover level at 2989 before finding some support at the Mid-Channel.

Strong selling at the echo high and at a projection for a high from the T structure, suggesting completion of the structure, unless we see a quick recovery.

Chart of S&P 500 for 25 September 2019

To receive detailed daily analysis, guidance and the updated daily Buy / Sell trigger levels being generated by the Trading the Line system before the market opens, and intra-day alerts when appropriate, please become a Member and Sign up for Alerts & Observations – includes access to Members Area, Explanatory Notes (pdf) for all of the concepts discussed, and Notes on Day Trading (pdf)

Disclaimer: This is the diary of a personal trading system, its methodology and the signals that it is producing. You are welcome to follow along but please understand that the information presented here is for educational purposes only. No recommendations are being made to buy, or sell stocks, options or futures contracts. Please consult your own financial advisor before making any investment decisions.