All numbers refer to SPX
…
Mercy mountain crevices hold treasures buried deep
A blizzard or rain can`t wash any memories that you keep
I just came in on the banana boat, got born only yesterday
Came down through the stars, I landed from Mars
Made my way through the Milky Way
Ian Brown, Bubbles, 2001
…
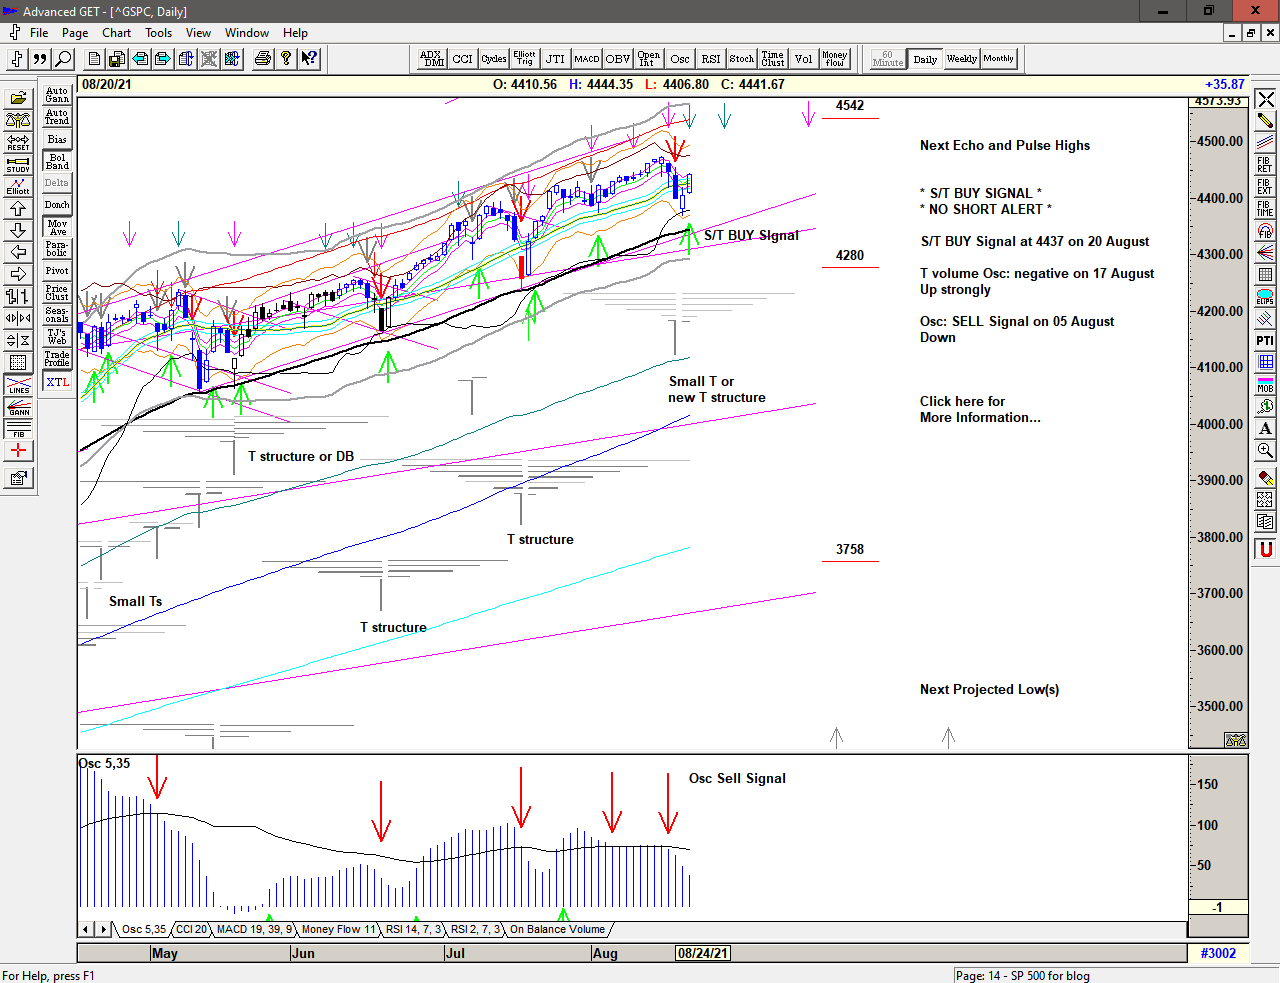
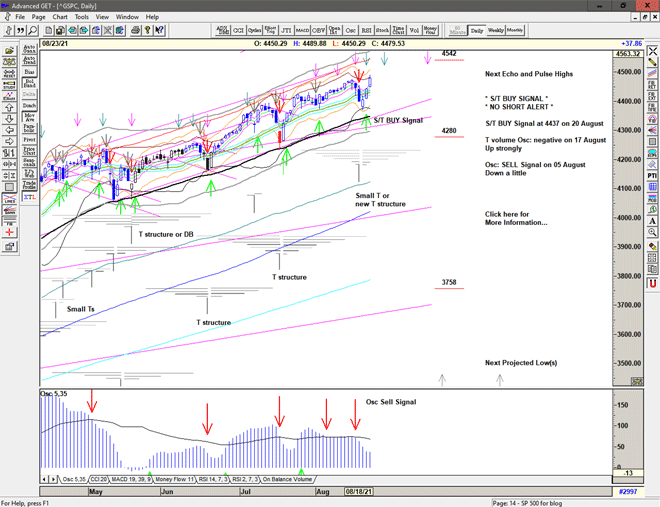
A quick FED induced taper tantrum is met with strong buying (again) and a push back above 4400 with a new S/T Buy Signal triggered above 4437.
More of the same or something different?
Save the image to your desktop to view a larger version
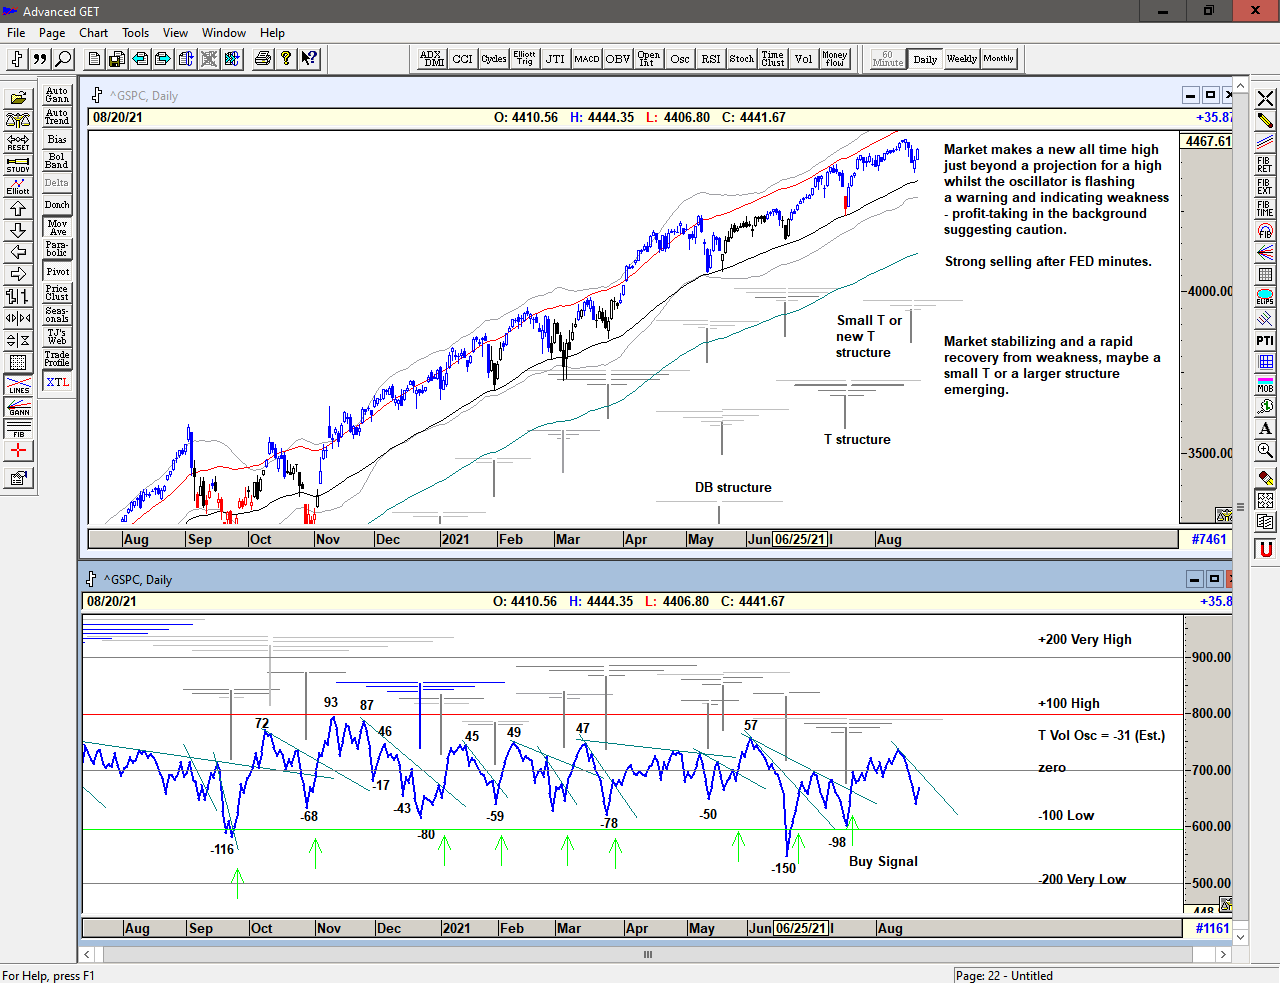
A grind higher into 4468 on 16 August – just beyond a projection for a high from the recent T structure and with warnings flashing from deterioration in breadth – is met with volatility, some strong selling and a rescue operation on 17 August. More selling sees strong buying at the open gap at 4367 and a rapid recovery – 2 days down and 2 days up.
Save the image to your desktop to view a larger version
The T volume oscillator 1 made a Buy Signal on 21 July with a rise upwards through the cash build up line 2 confirming the recent T structure emerging from the 19 July low with projections for highs from the previous oscillator and price highs for 09 August and 13 August repectively, and perhaps beyond with full potential into late August.
The lack lustre oscillator indicated profit-taking going on in the back ground, and made the market vulnerable to a swift decline.
The v shaped recovery in the oscillator and price – so far – indicates that there is now a new small T or perhaps a larger T structure emerging from the 18 August low, but it is not yet fully confirmed.
A small T would suggest strength into a recovery high early this week and a subsequent collapse – re-test the low or below, and a new T structure would hold onto the gains, consolidate and draw strength from the previous highs into the longer projections for highs – perhaps into early September.
1 The T volume oscillator is an indication of Buying Power within the market as a whole
2 The cash build-up line is a declining line drawn above a series of lower highs made in the oscillator.
Save the image to your desktop to view a larger version
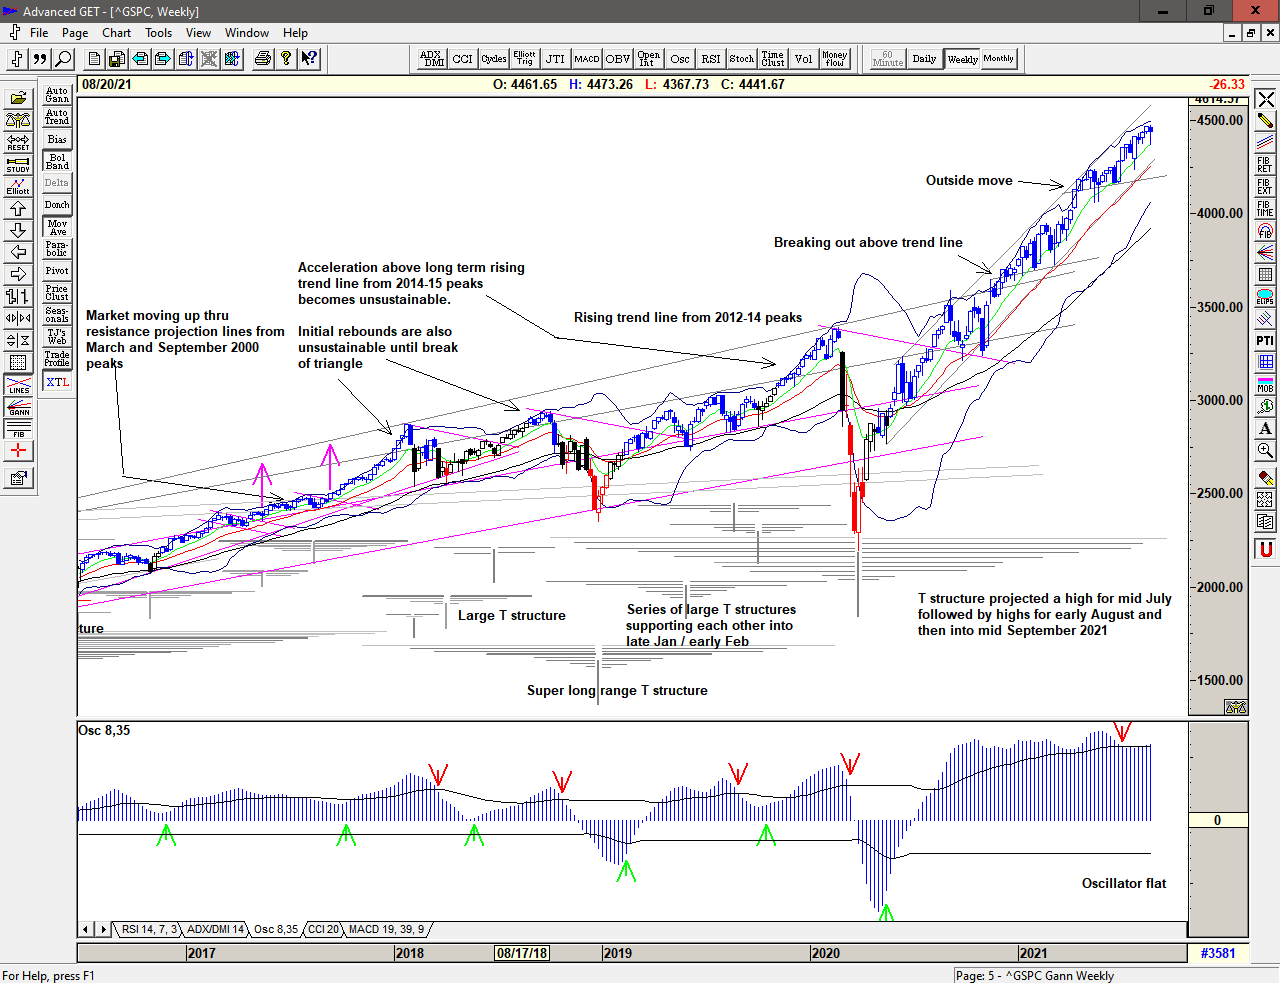
In the weekly chart above, we can see that price continues to be strong within the rising channel established over the past year, Although the momentum oscillator was declining slightly and flashing a warning, price has recovered from each of the probes lower, building support for higher prices.
The large structure, centered at the March 2020 low projected strength into Mid July and early August, with another projection into perhaps a more important high for mid September 2021, projected from the high in September 2018.
Save the image to your desktop to view a larger version
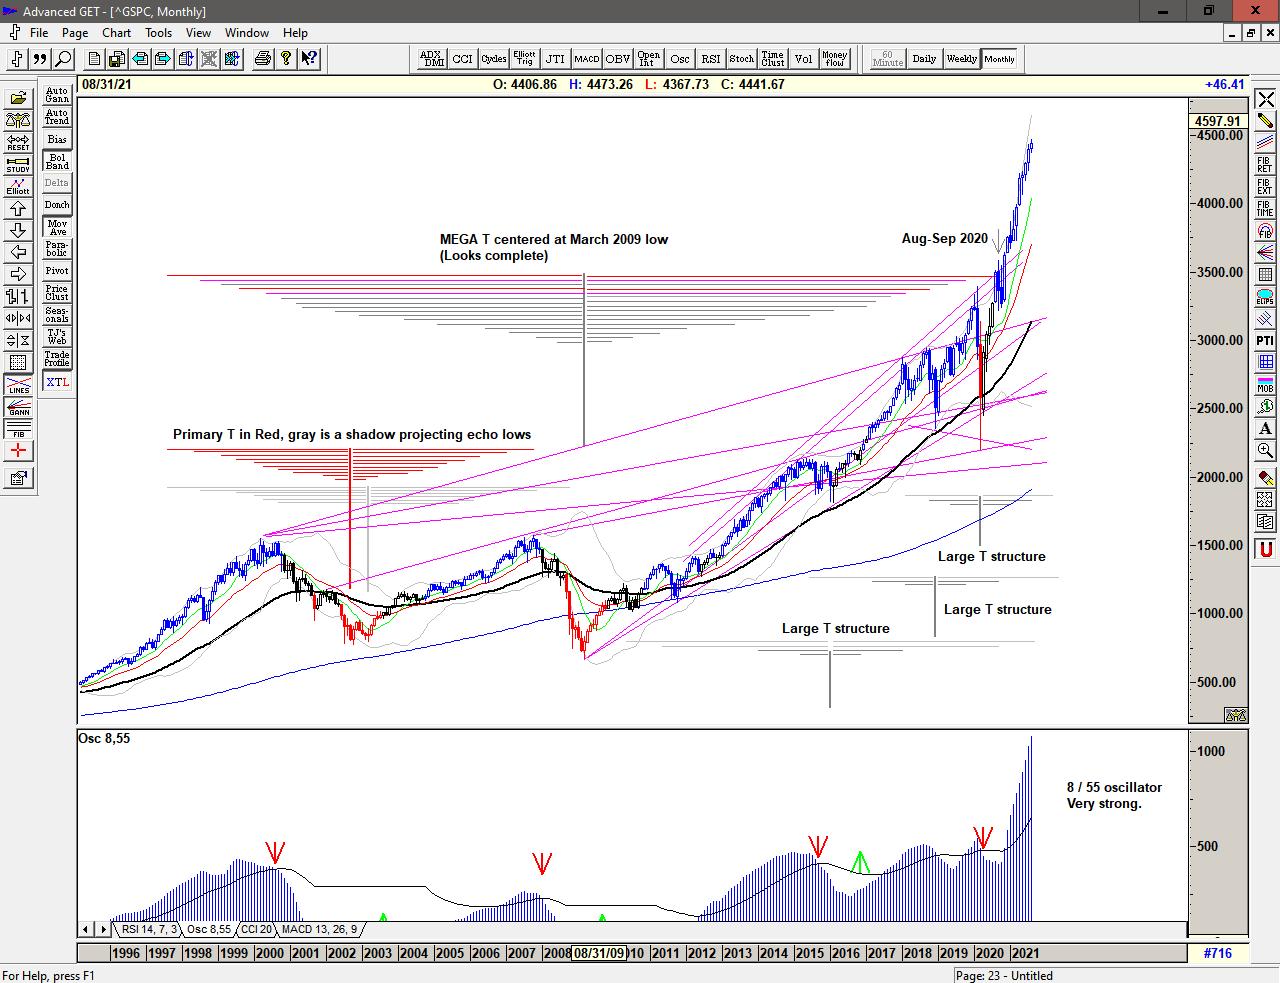
The monthly chart continues to look excessive but the market continues higher beyond the last projection for a major high from the Mega T structure, which now looks like it completed with the declines in February 2020 and September 2020.
The current large structures project highs for August and/or for September 2021 and possibly longer into March and/or May 2022.
We should therefore be prepared for a change in direction to occur soon.
…
2021 continues with a range that has become increasingly expansive since the move above 2500. With price above 4400 we can only assume that this will continue. This is a Brave New World and we should trade accordingly.
–
Regardless of whether the market can continue higher or whether significant lows are ahead of us, the simplicity of the proprietary price based S/T Signalling System will continue to keep us on the correct side of the market, with price currently back on a Buy Signal since moving above 4437 on 20 August 2021.
If you would like to learn more about using the S/T Signalling System please get in touch.
–
To receive detailed daily analysis, guidance and the updated daily Buy / Sell trigger levels being generated by the Trading the Line system before the market opens, and intra-day alerts when appropriate, please become a Member and Sign up for Alerts & Observations – includes access to Members Area, Explanatory Notes (pdf) for all of the concepts discussed, and Notes on Day Trading (pdf)
Disclaimer: This is the diary of a personal trading system, its methodology and the signals that it is producing. You are welcome to follow along but please understand that the information presented here is for educational purposes only. No recommendations are being made to buy, or sell stocks, options or futures contracts. Please consult your own financial advisor before making any investment decisions.


