January 2024

All numbers refer to SPX

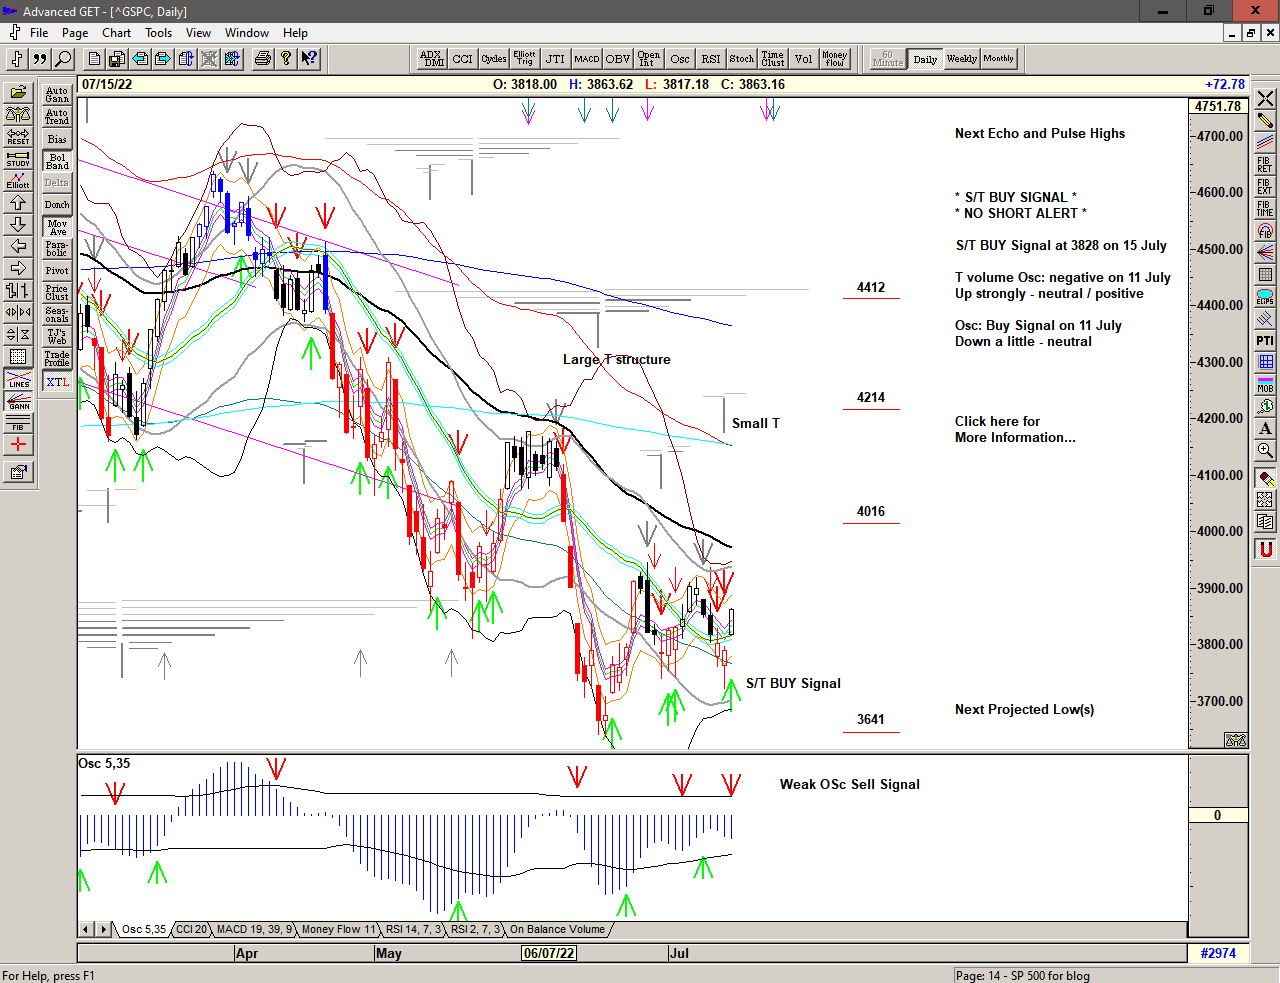
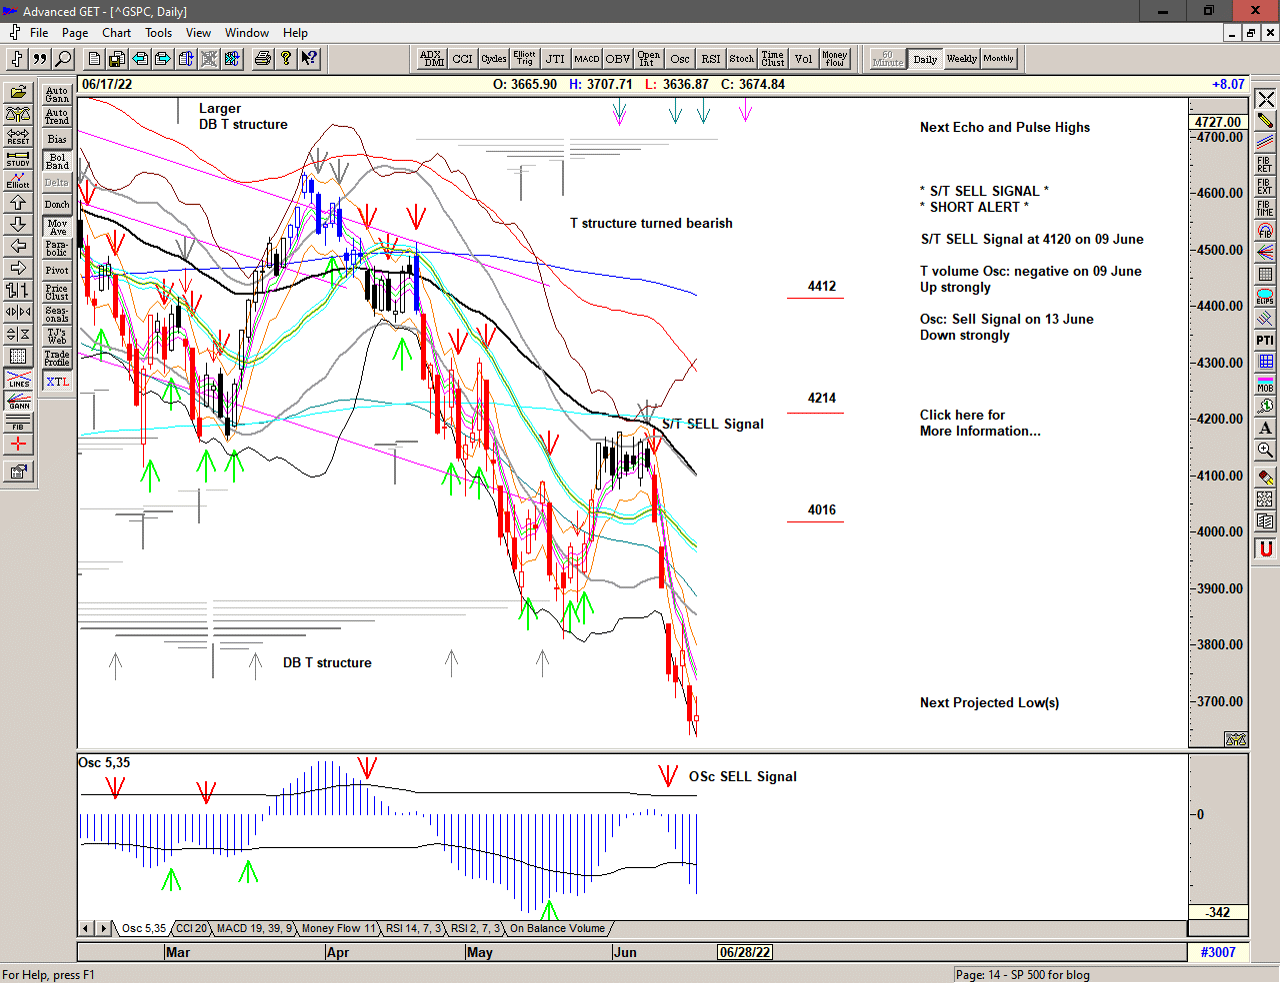
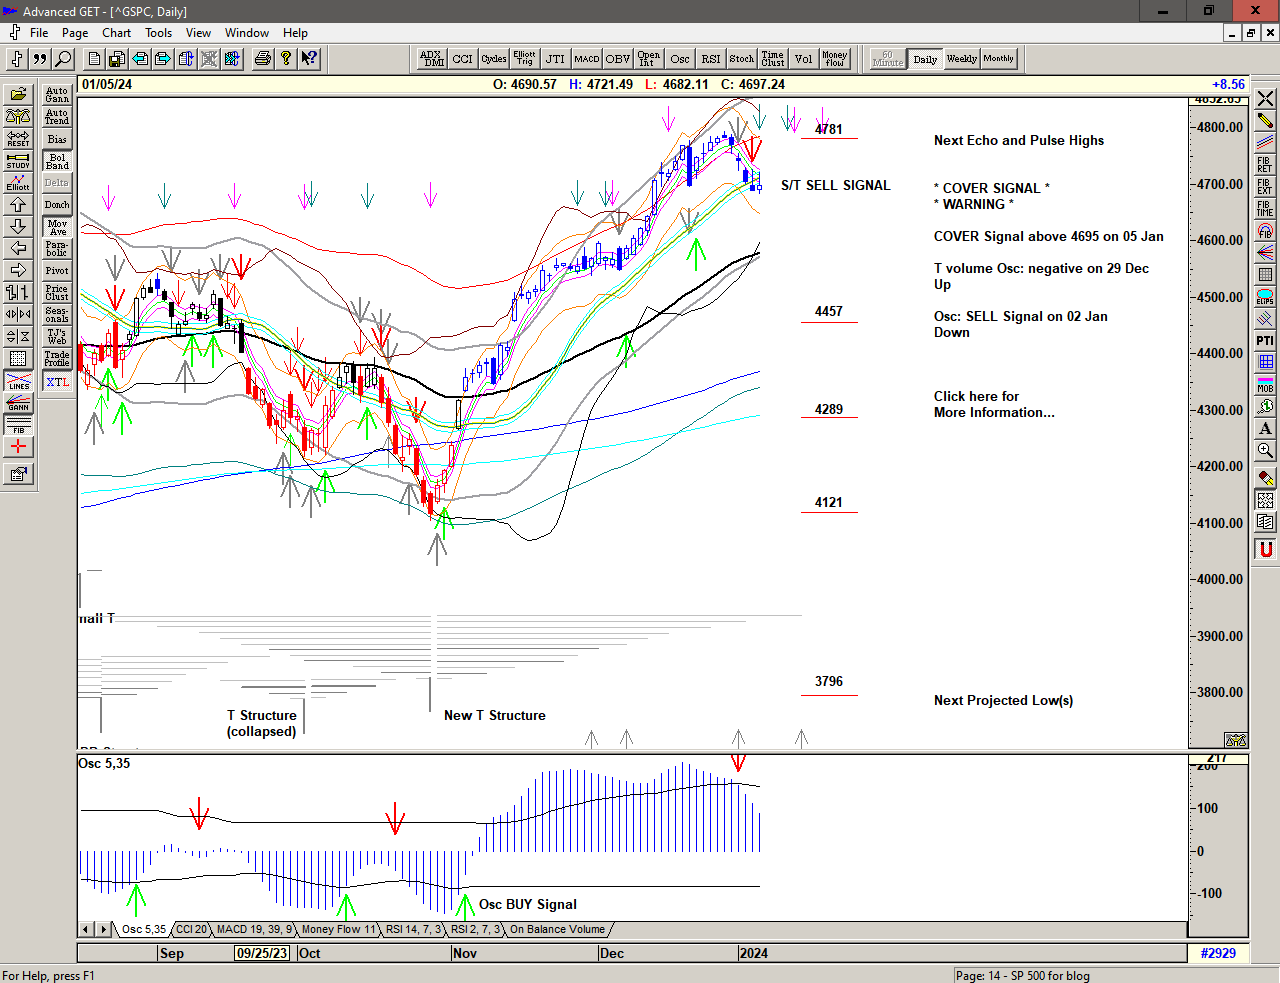
A strong close of 2023 with the rebound from the pre-Christmas high into a projection for a high for 26 December, and an important recovery into the area of the all time highs, followed by some early weakness in 2024.

Target acheived, at least for now.

Daily chart of S&P 500 for 08 January 2024

Save the image to your desktop to view a larger version

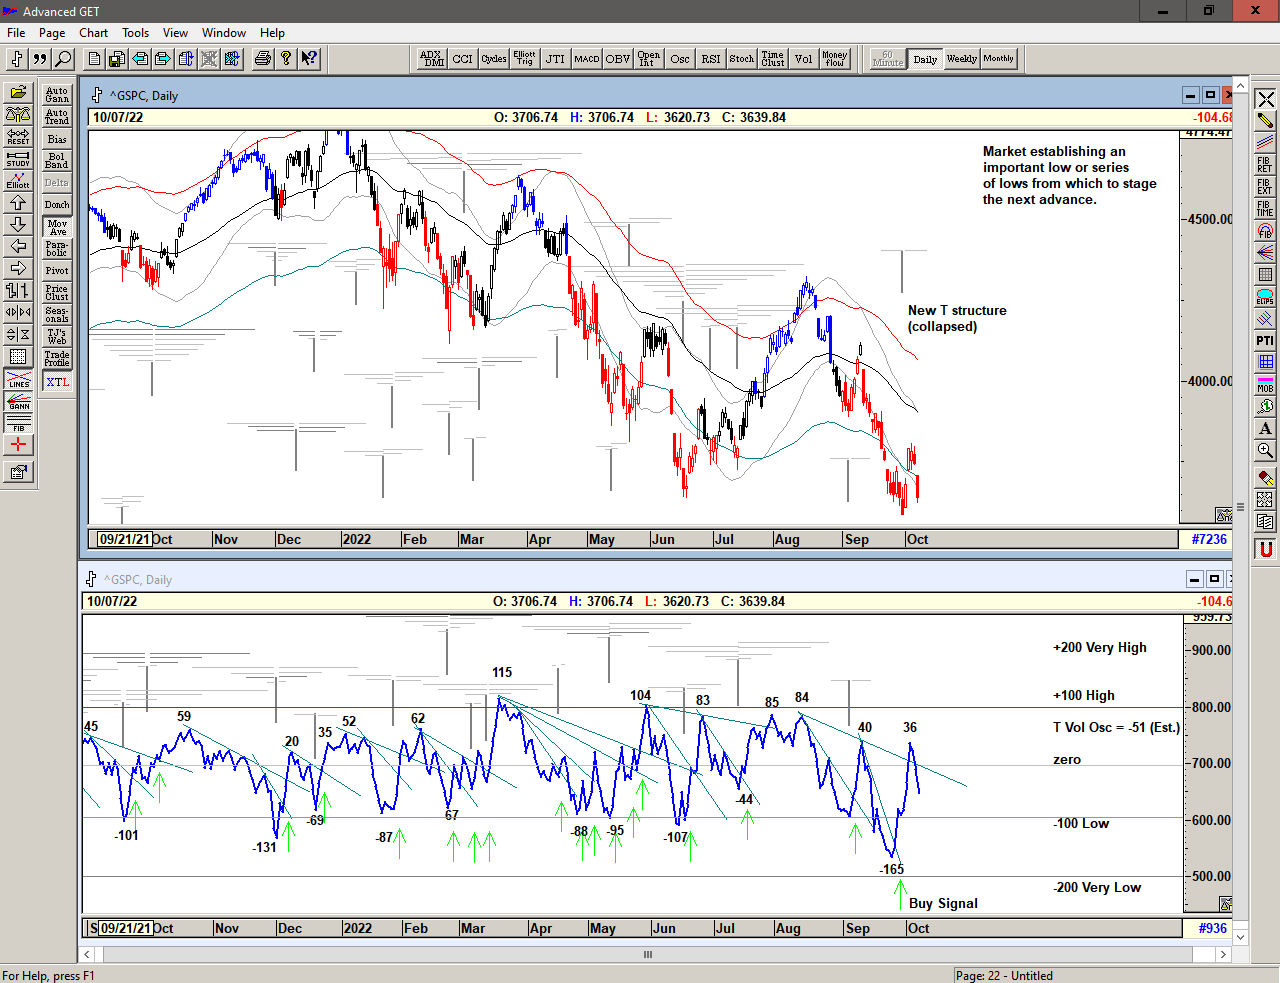
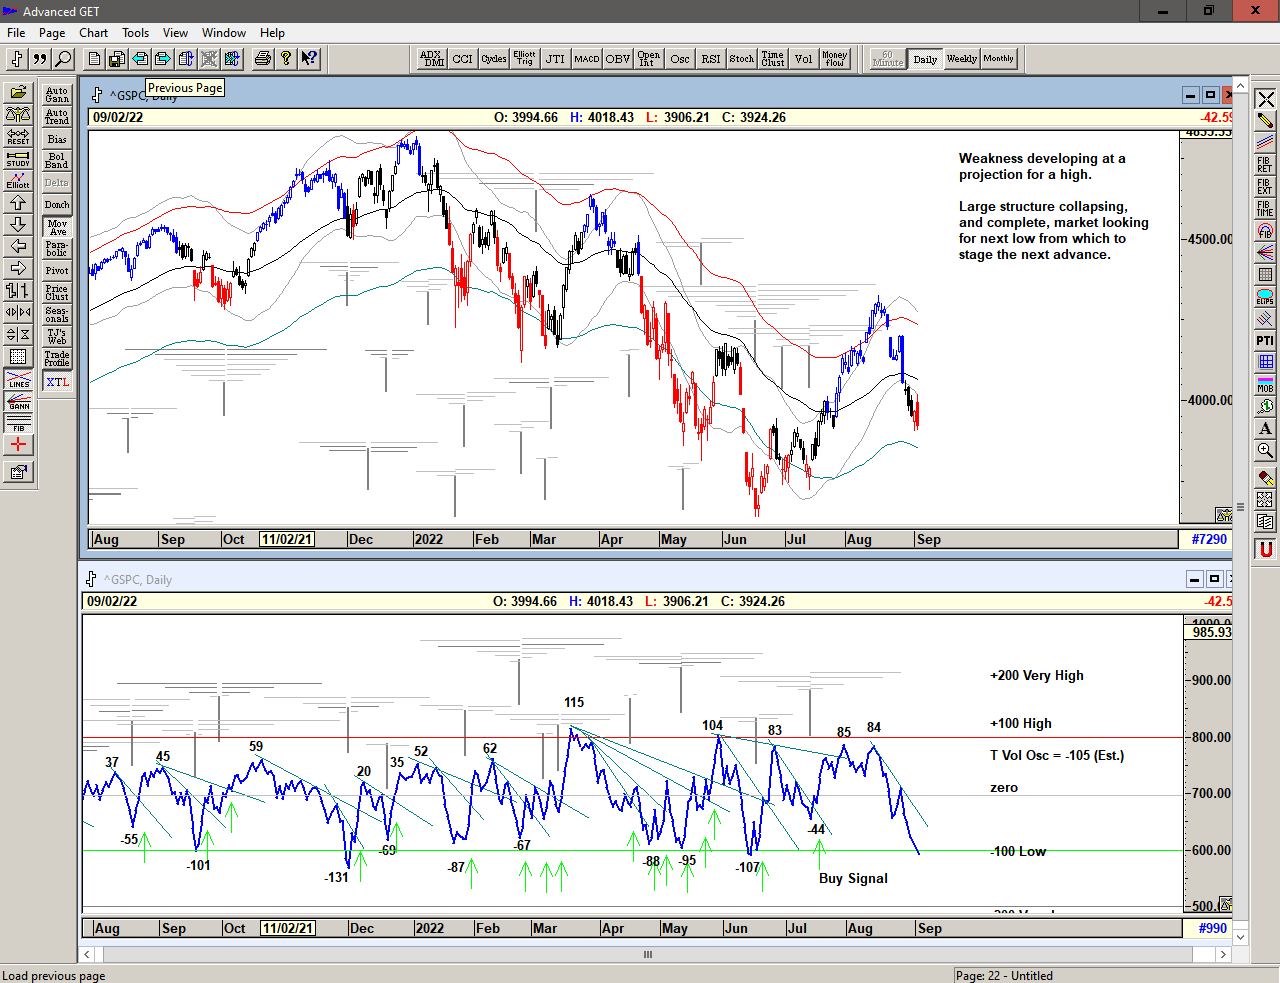
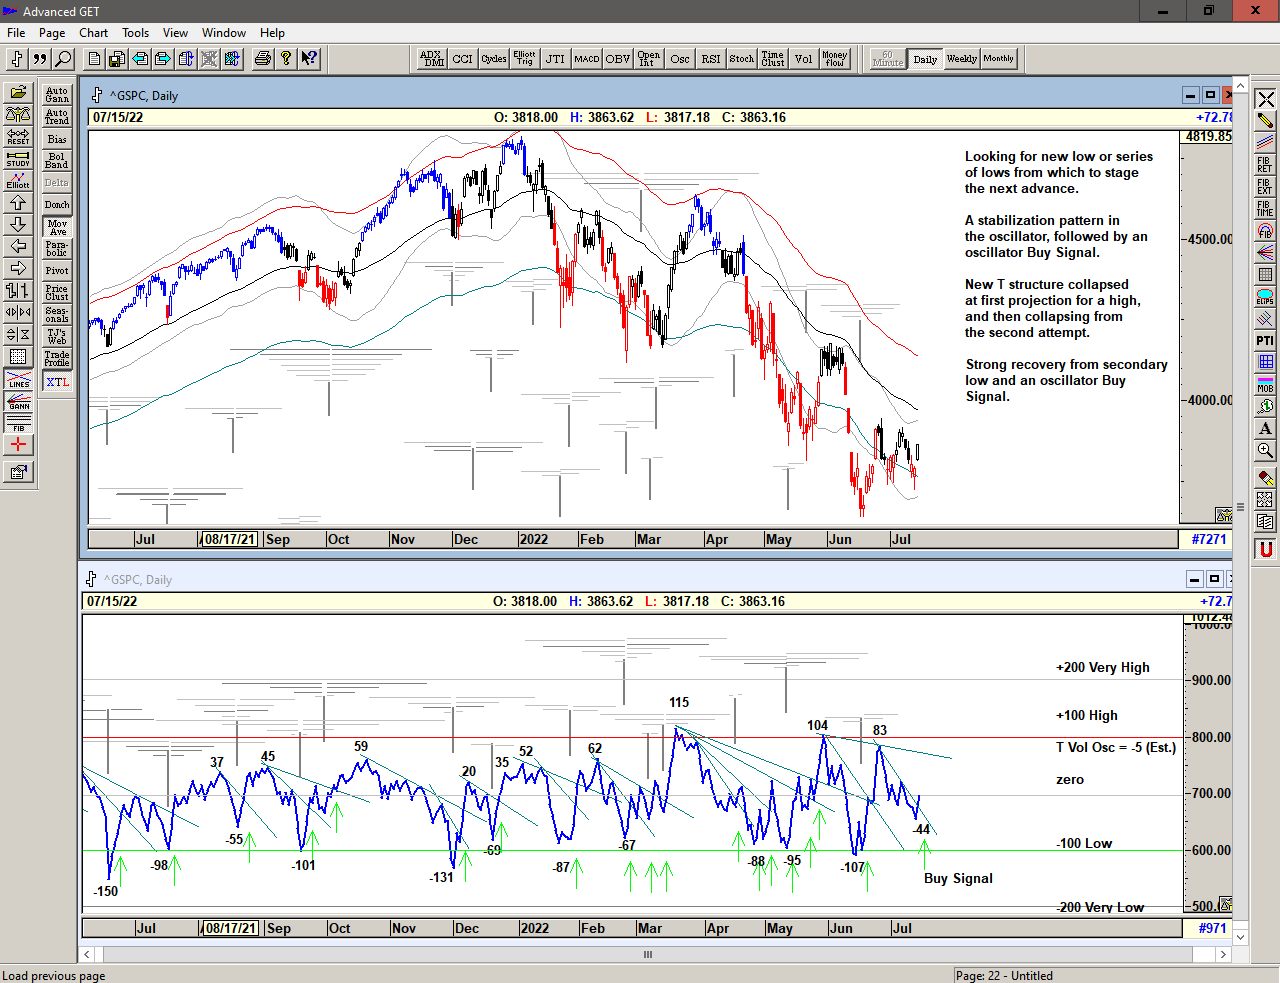
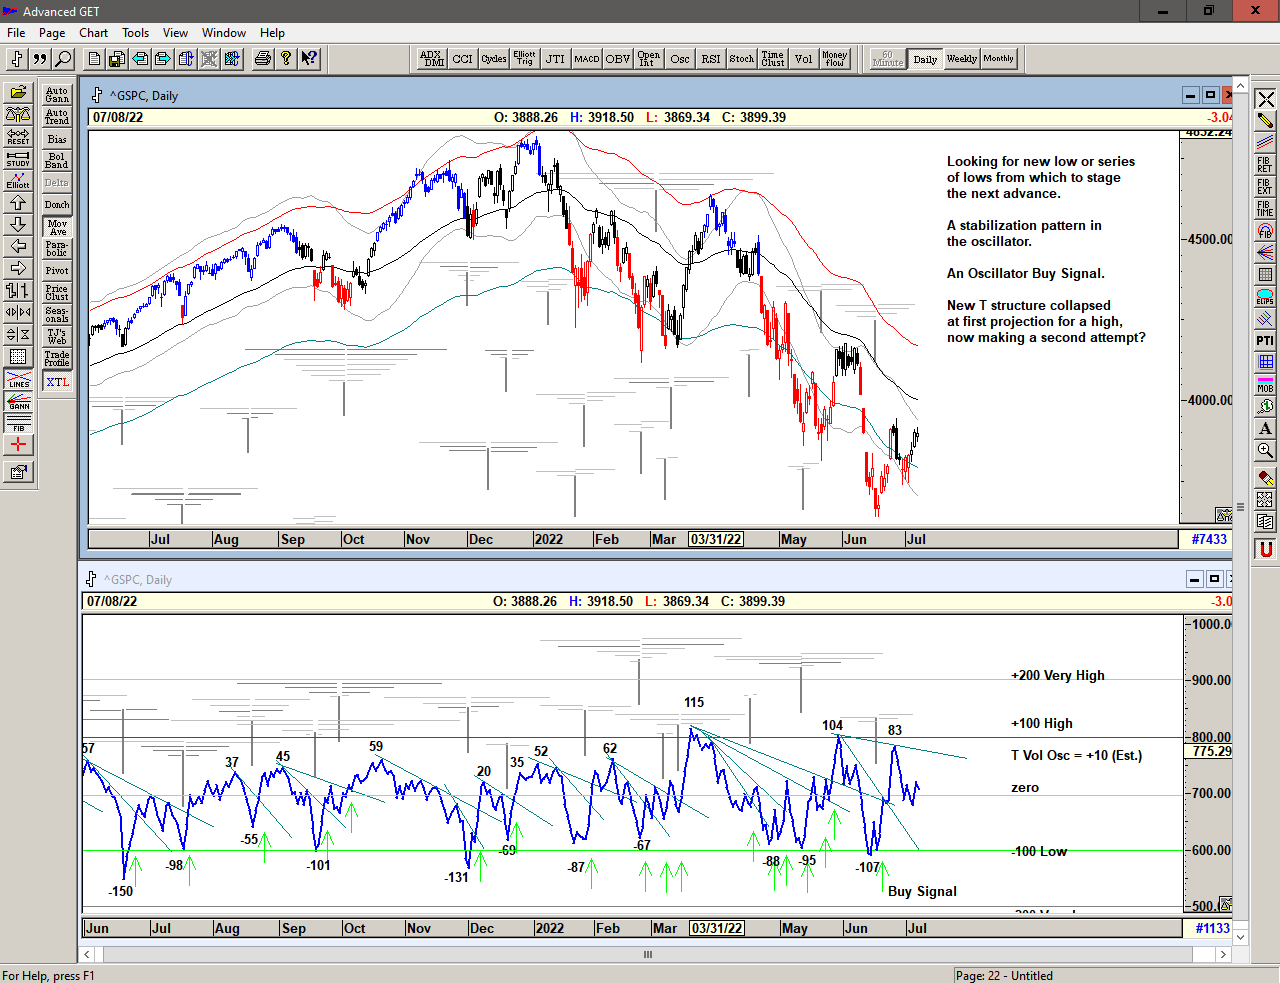
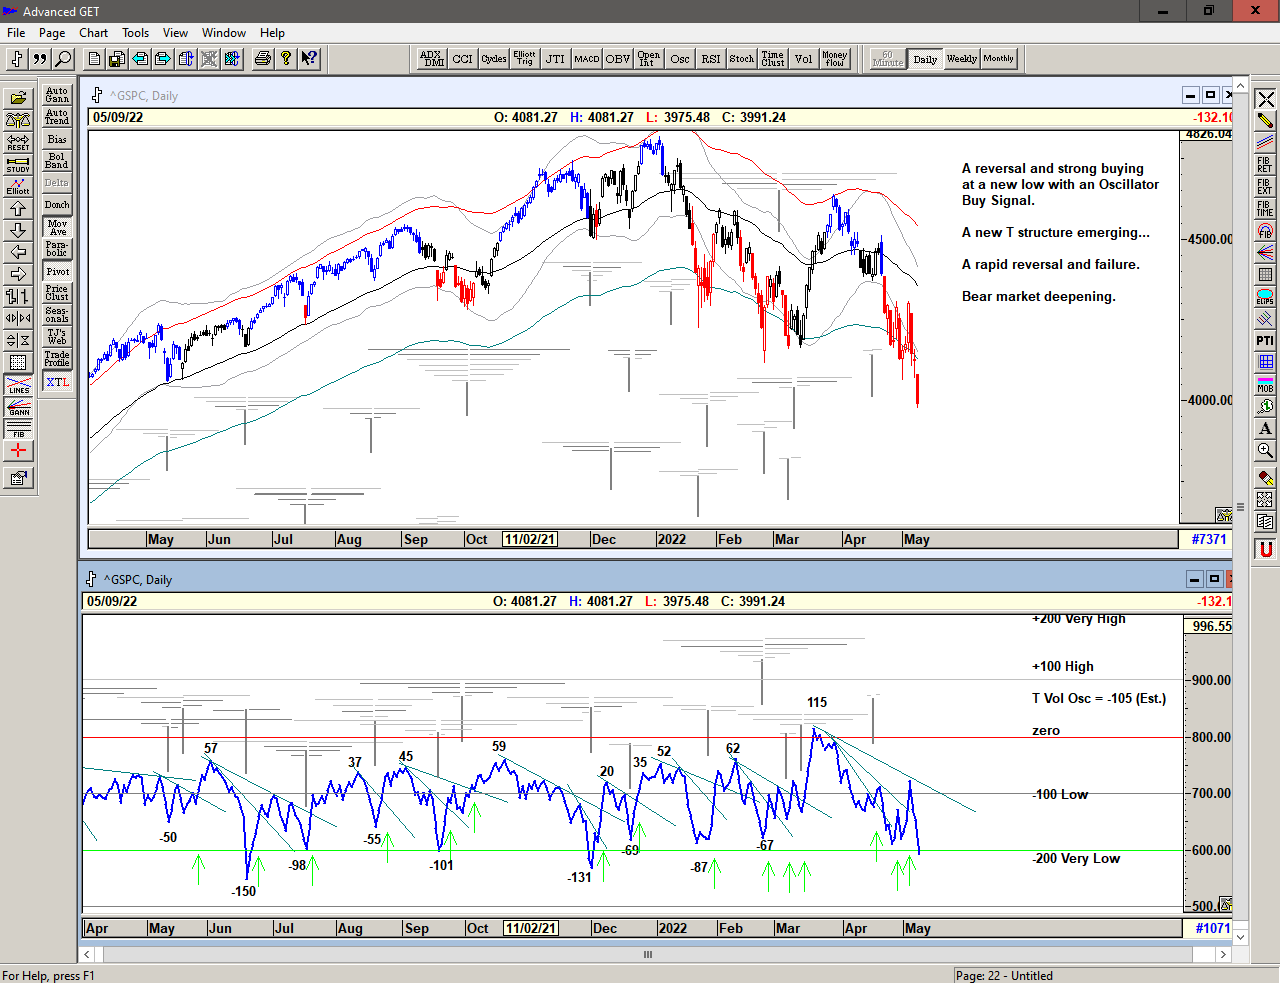
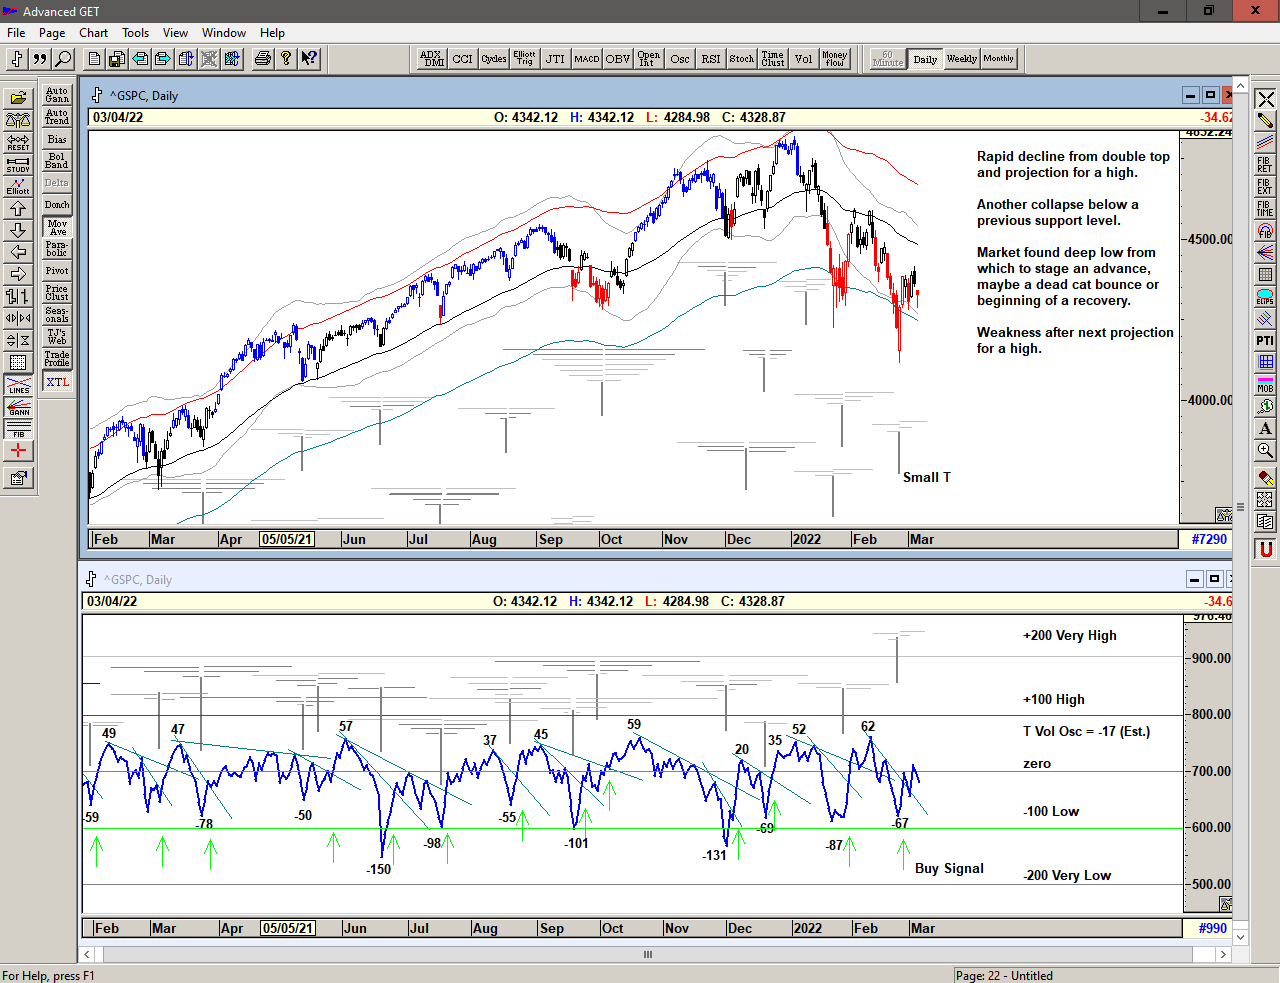
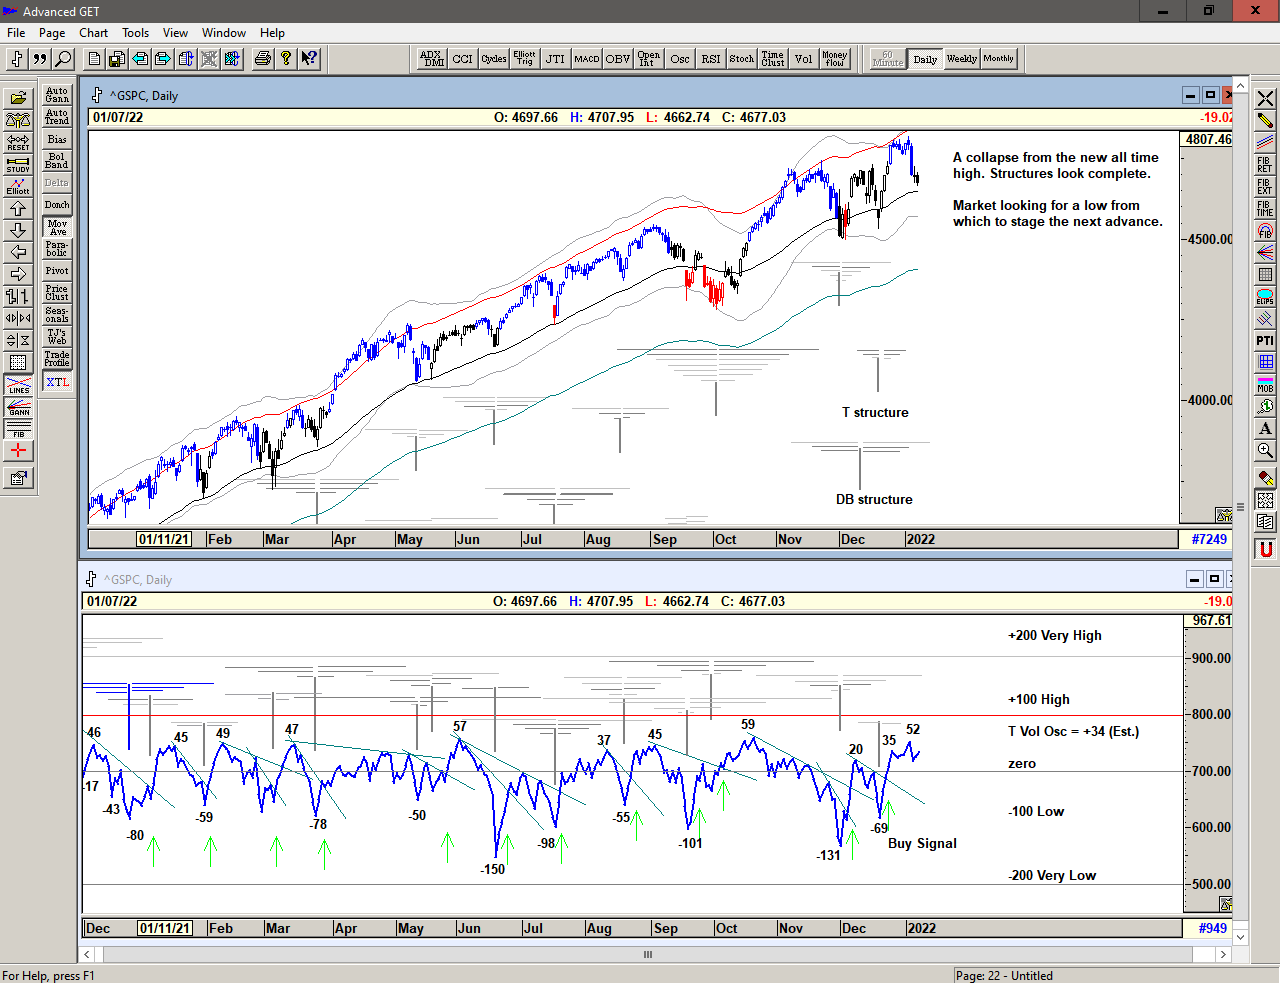
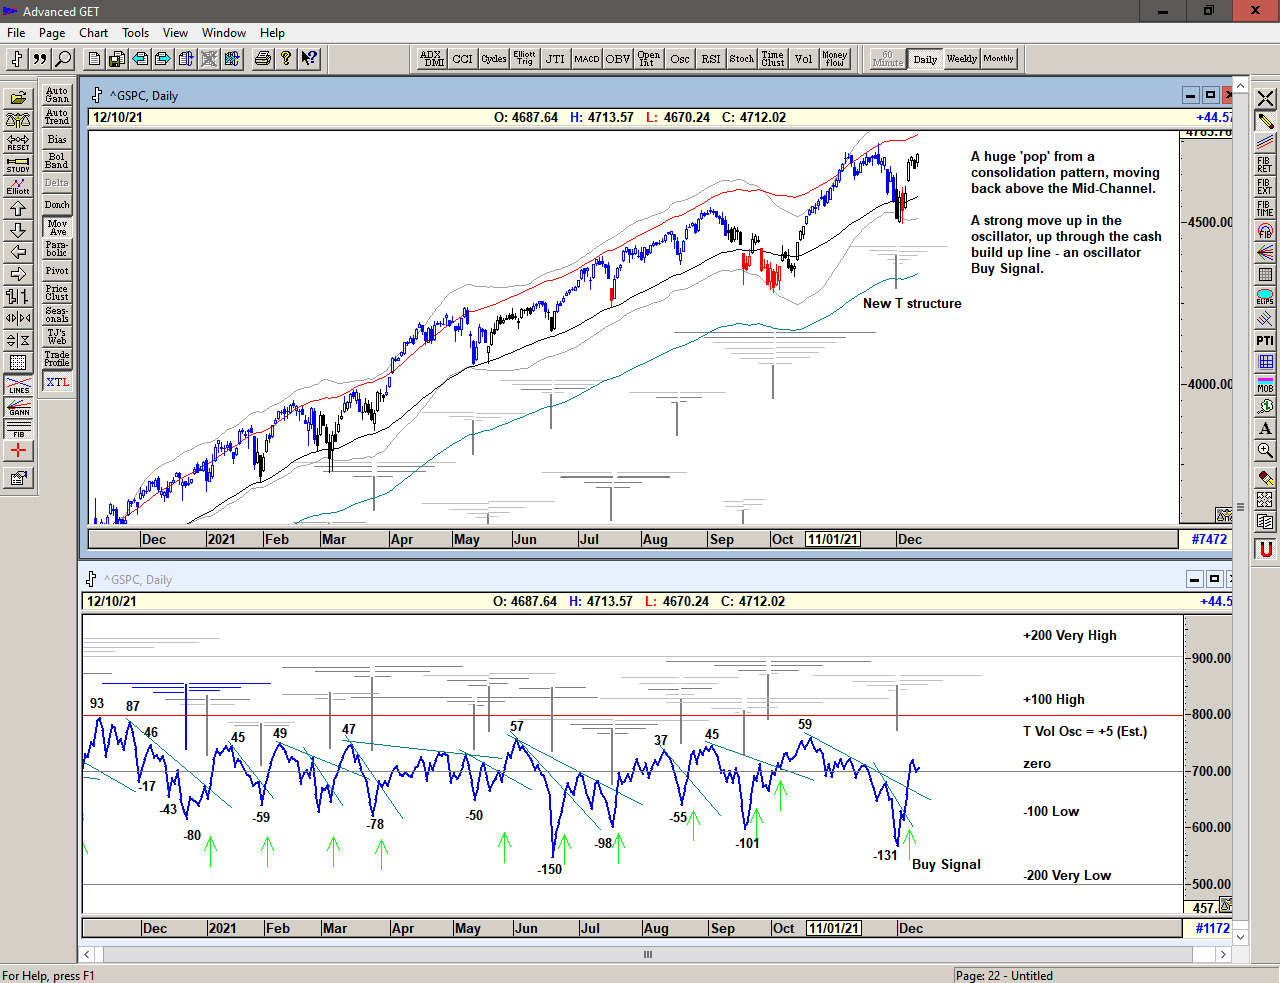
Stabilization after the strong move since October 2023.

Chart of S&P 500 with T volume oscillator for 08 January 2024

Save the image to your desktop to view a larger version

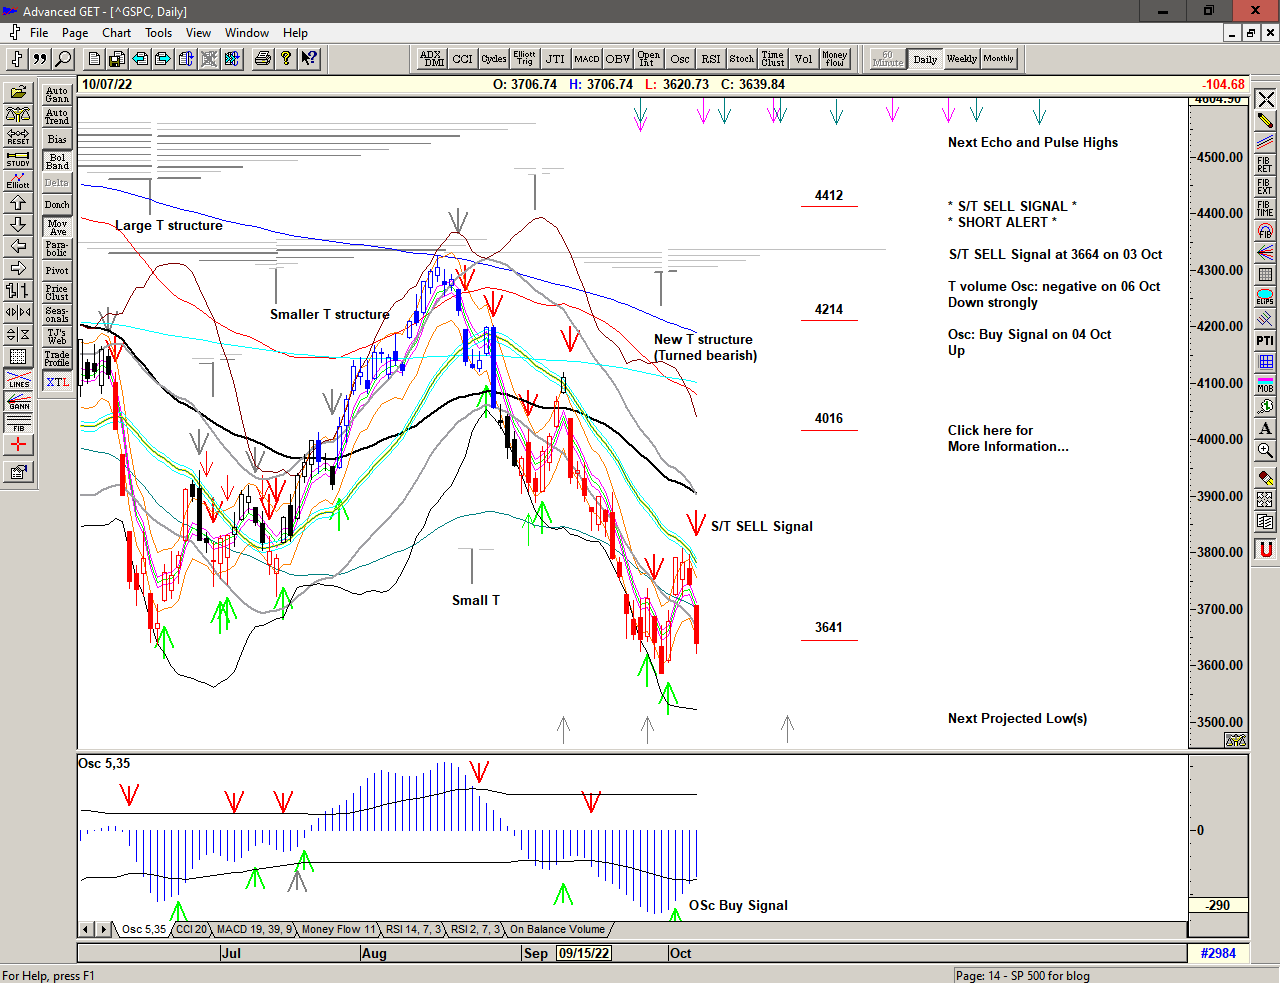
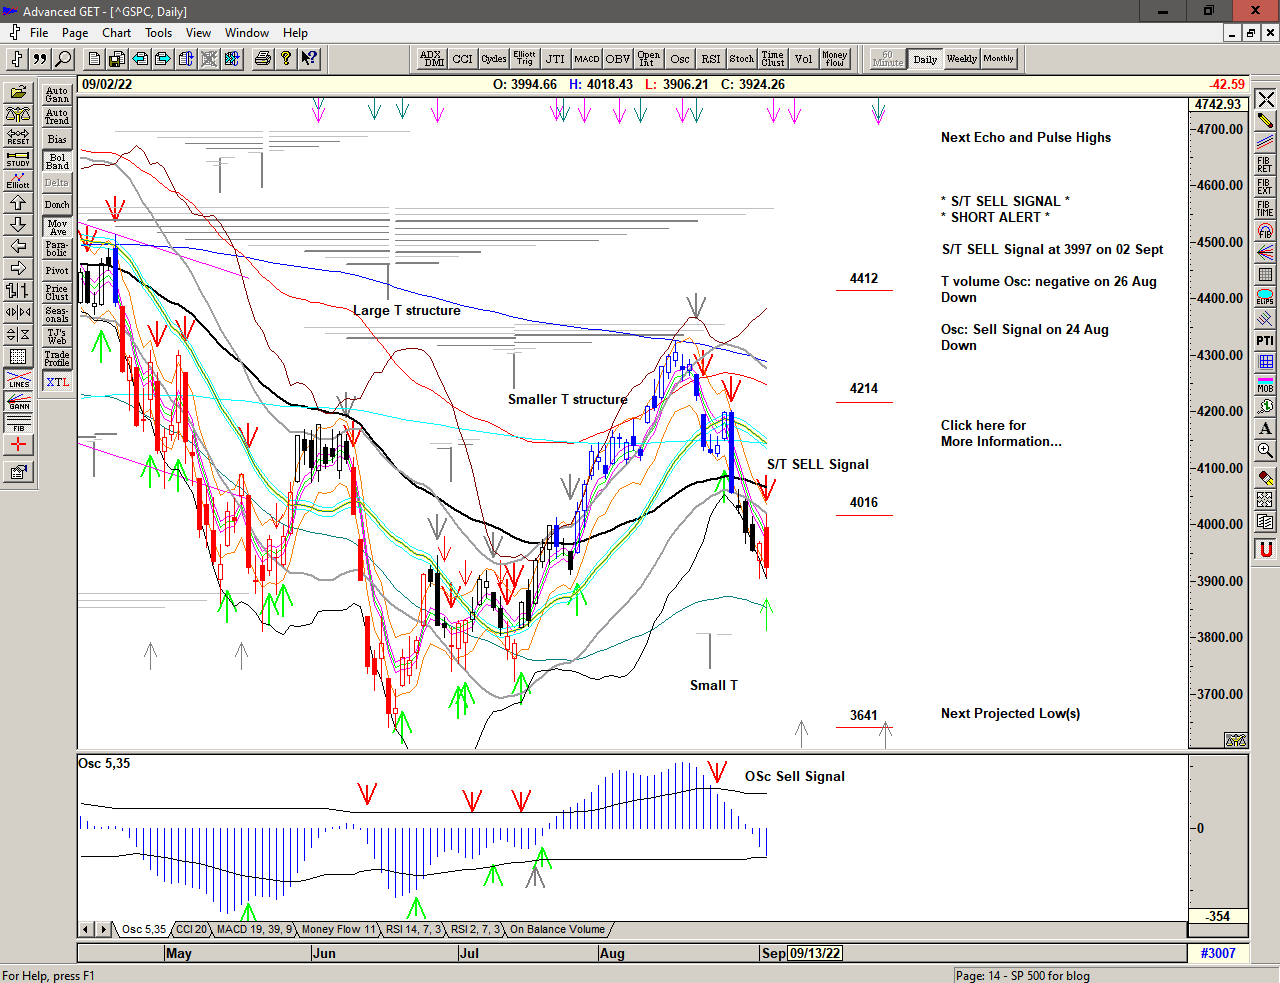
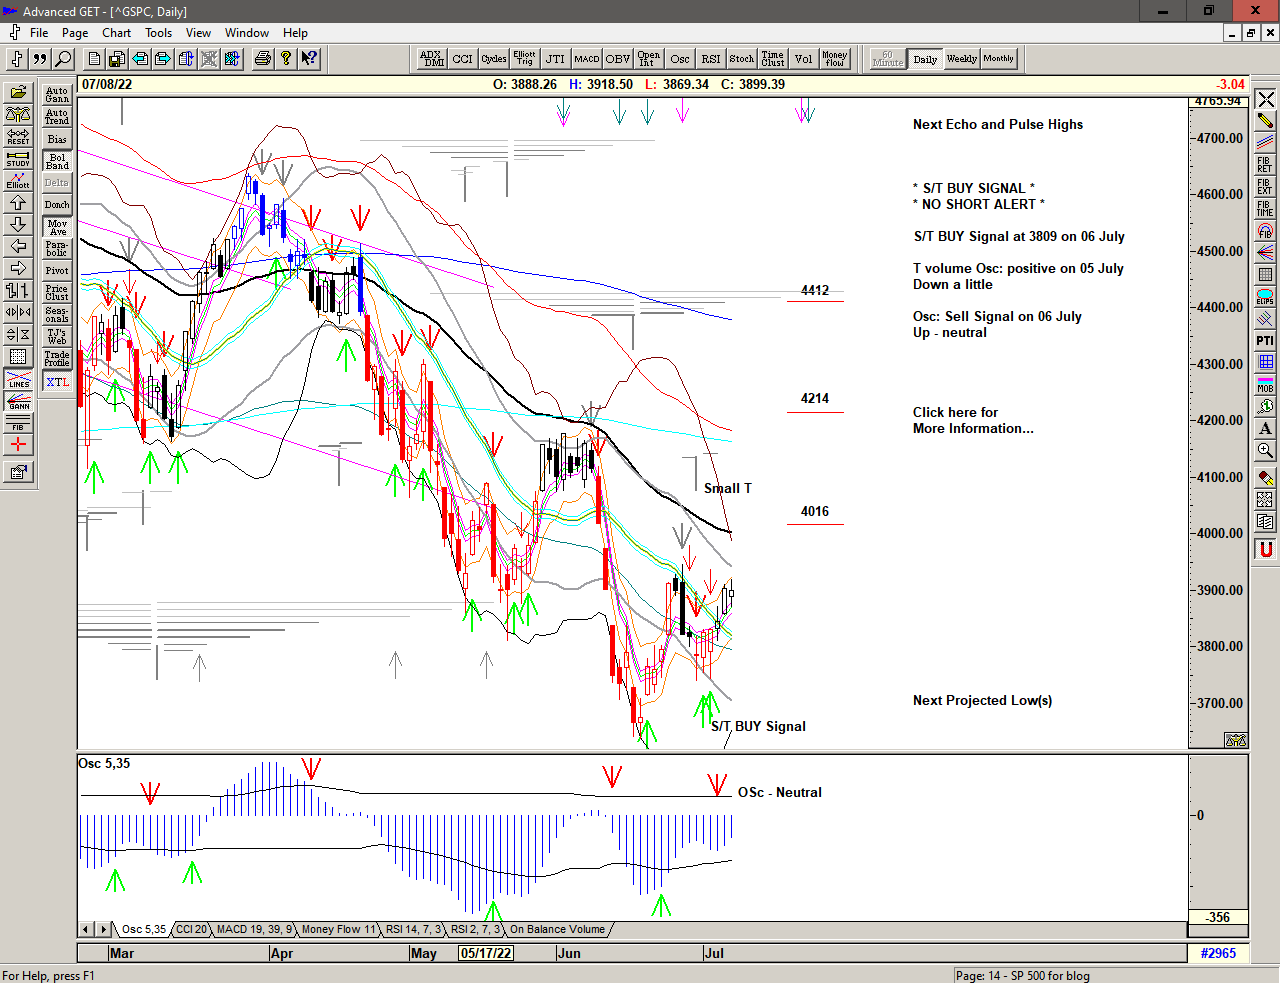
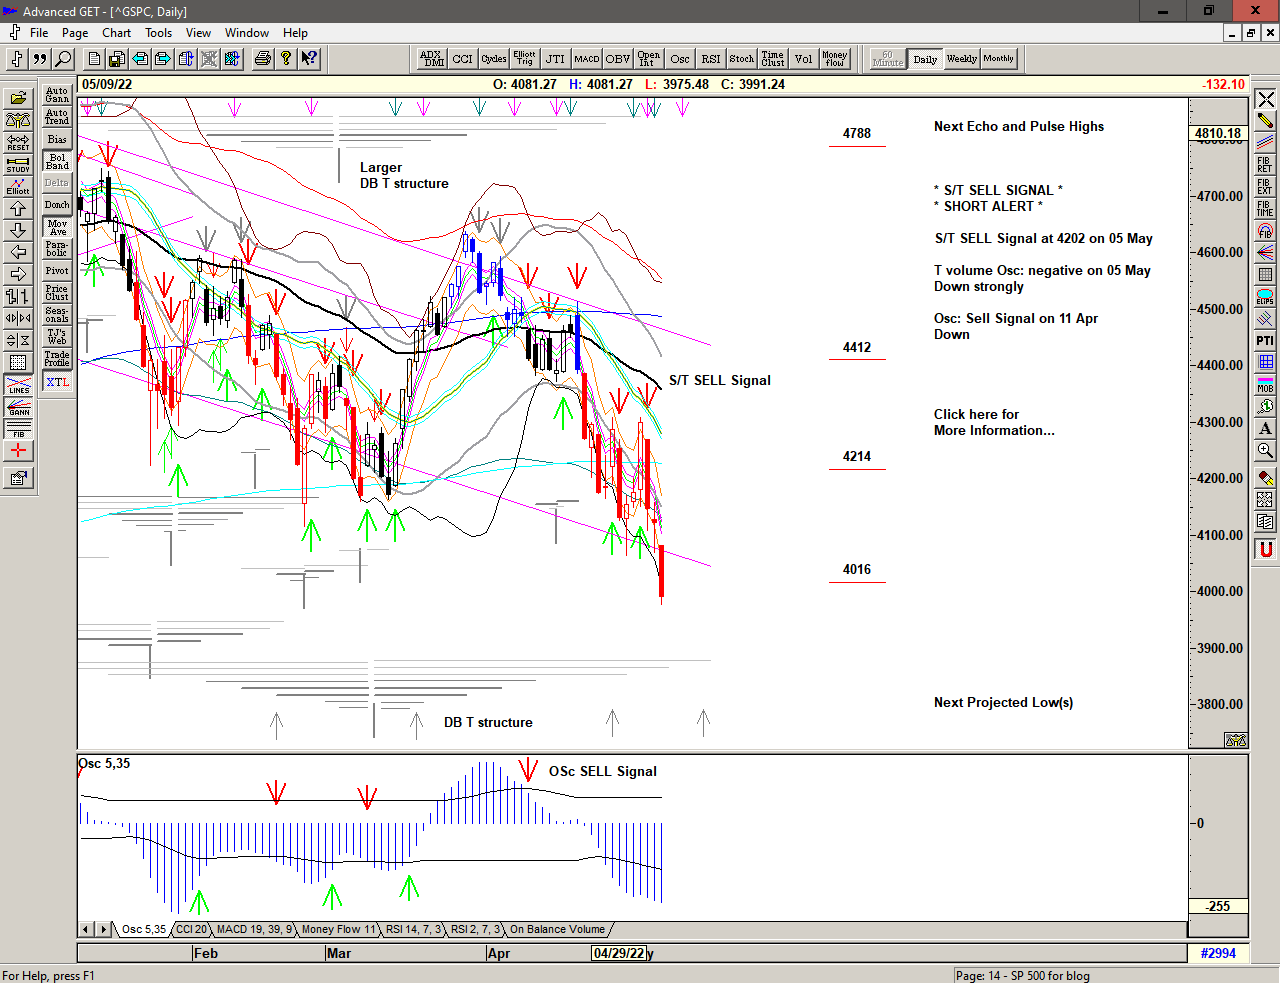
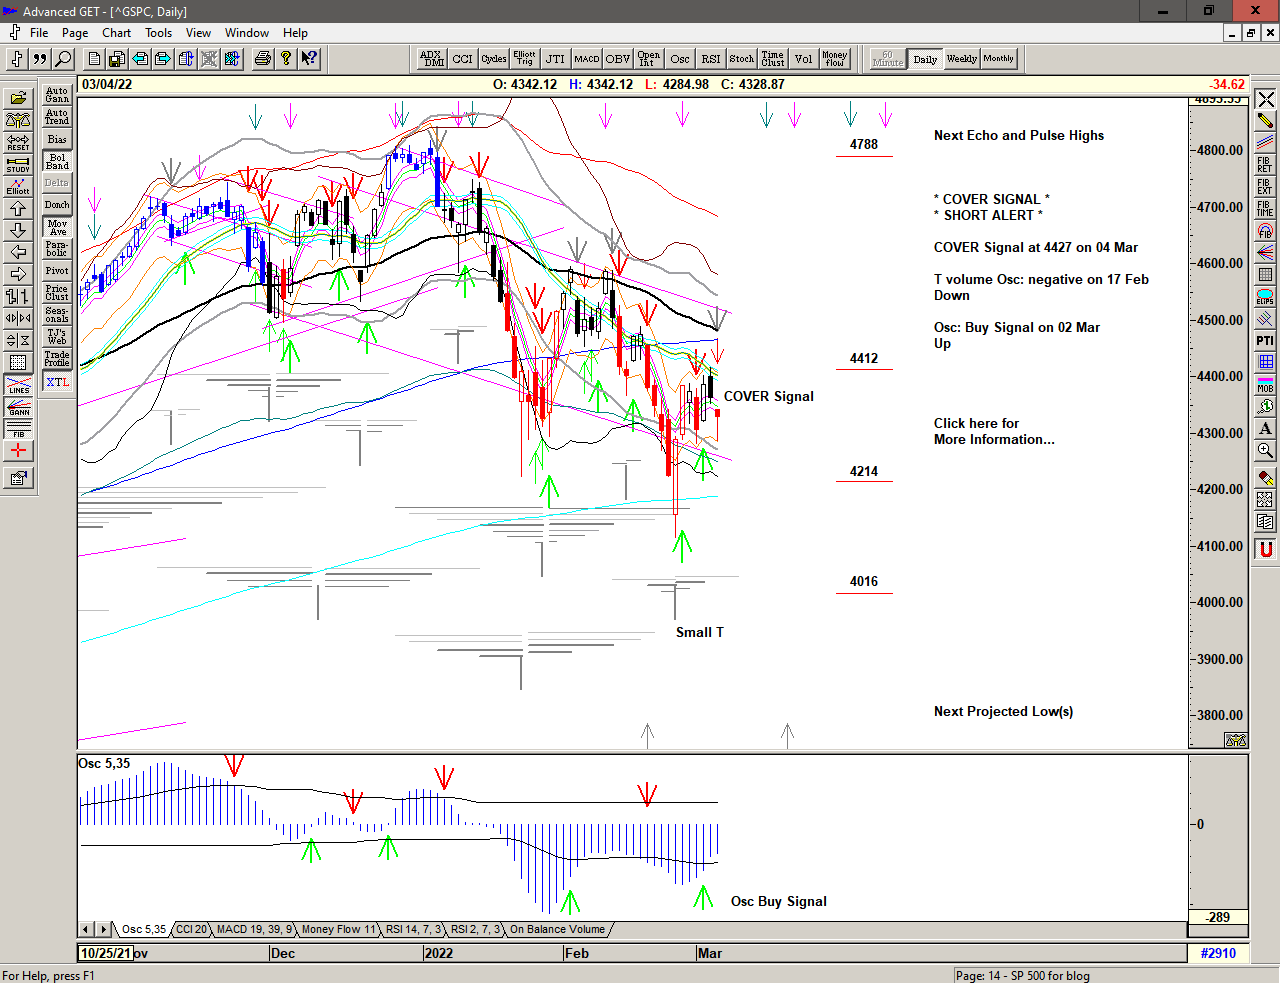
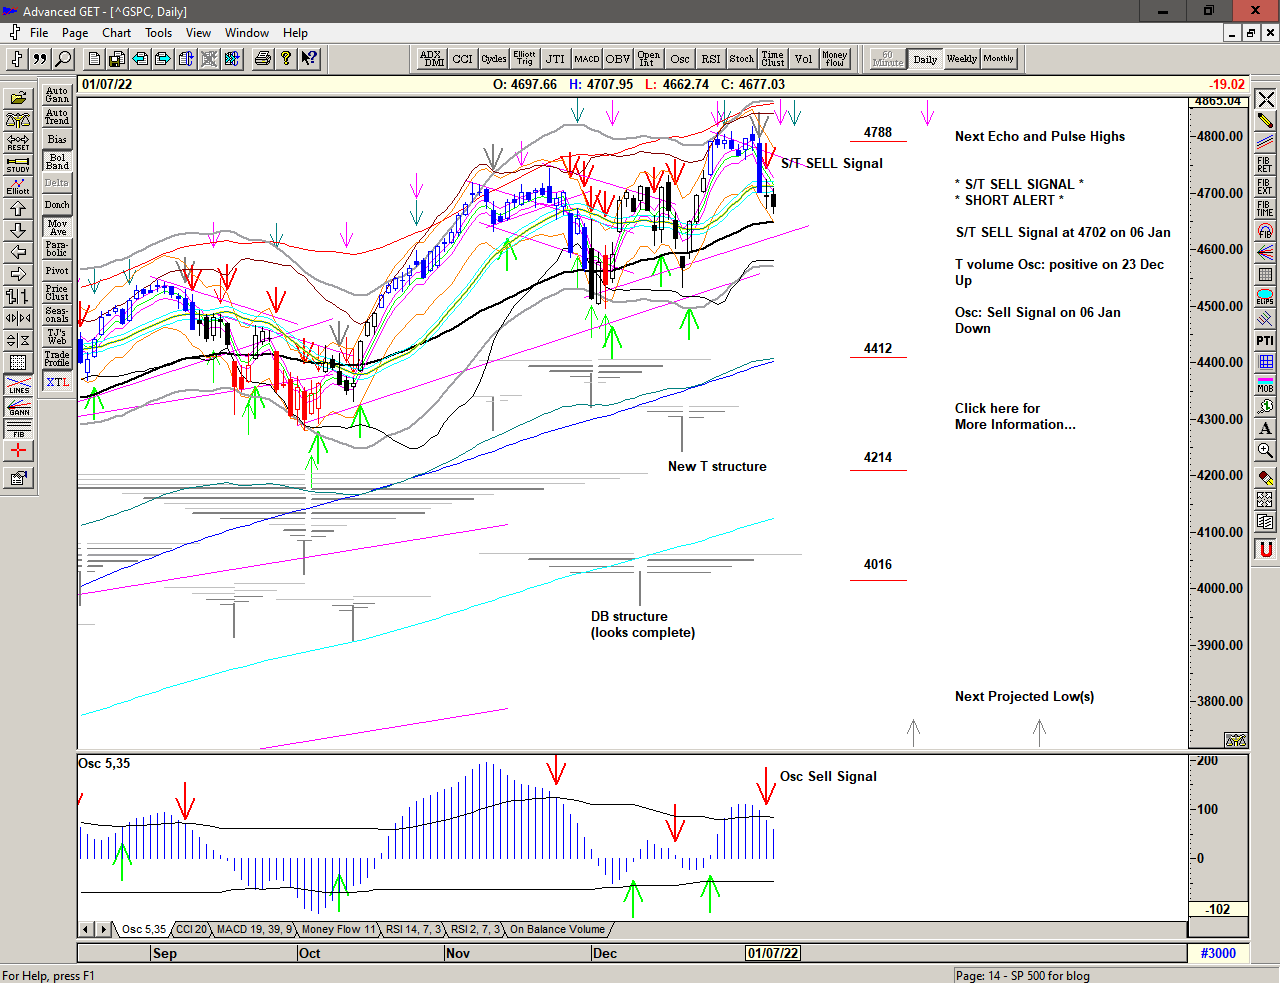
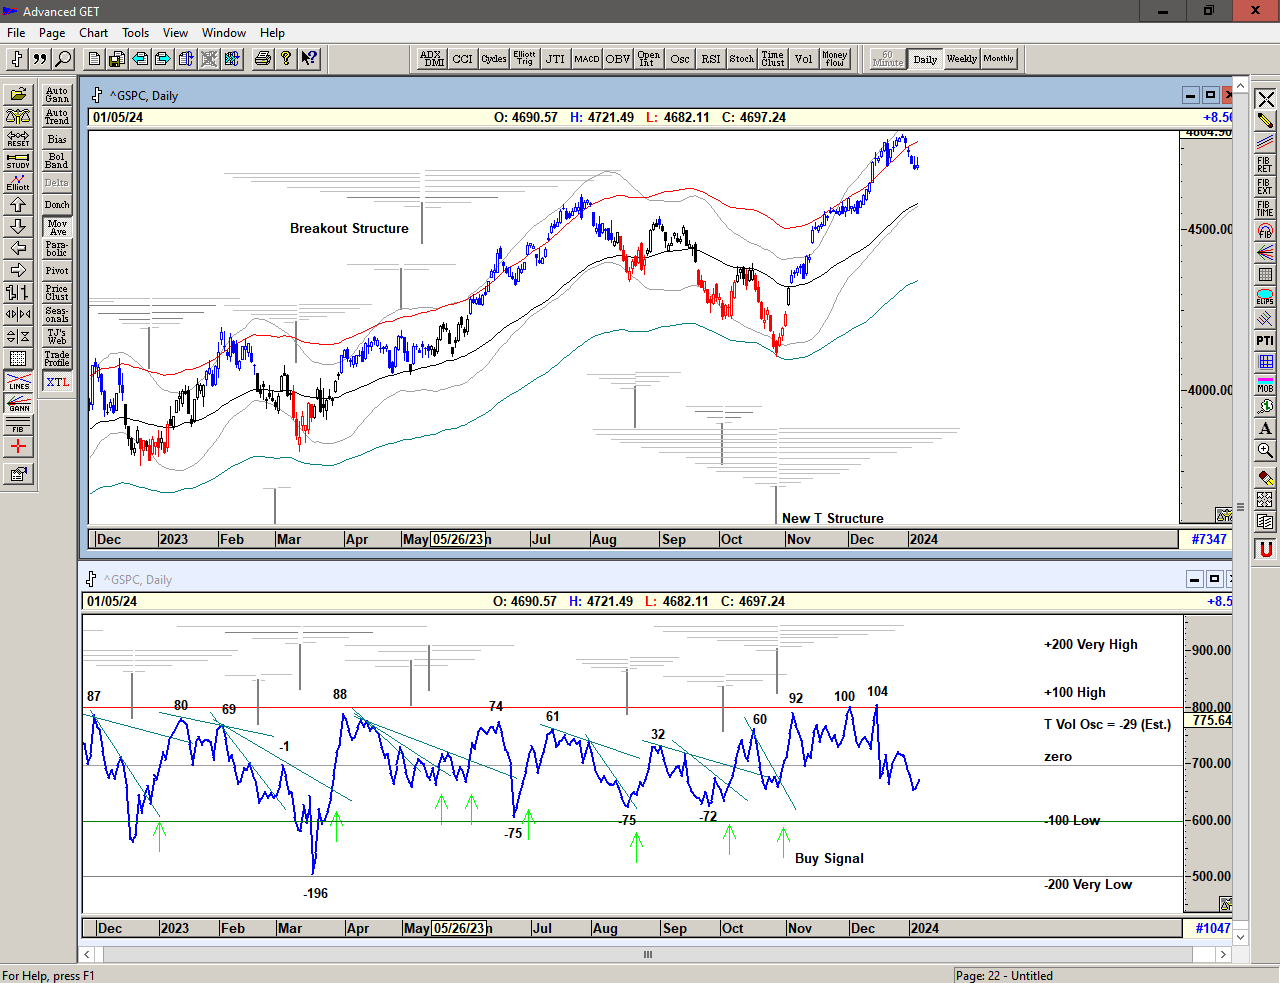
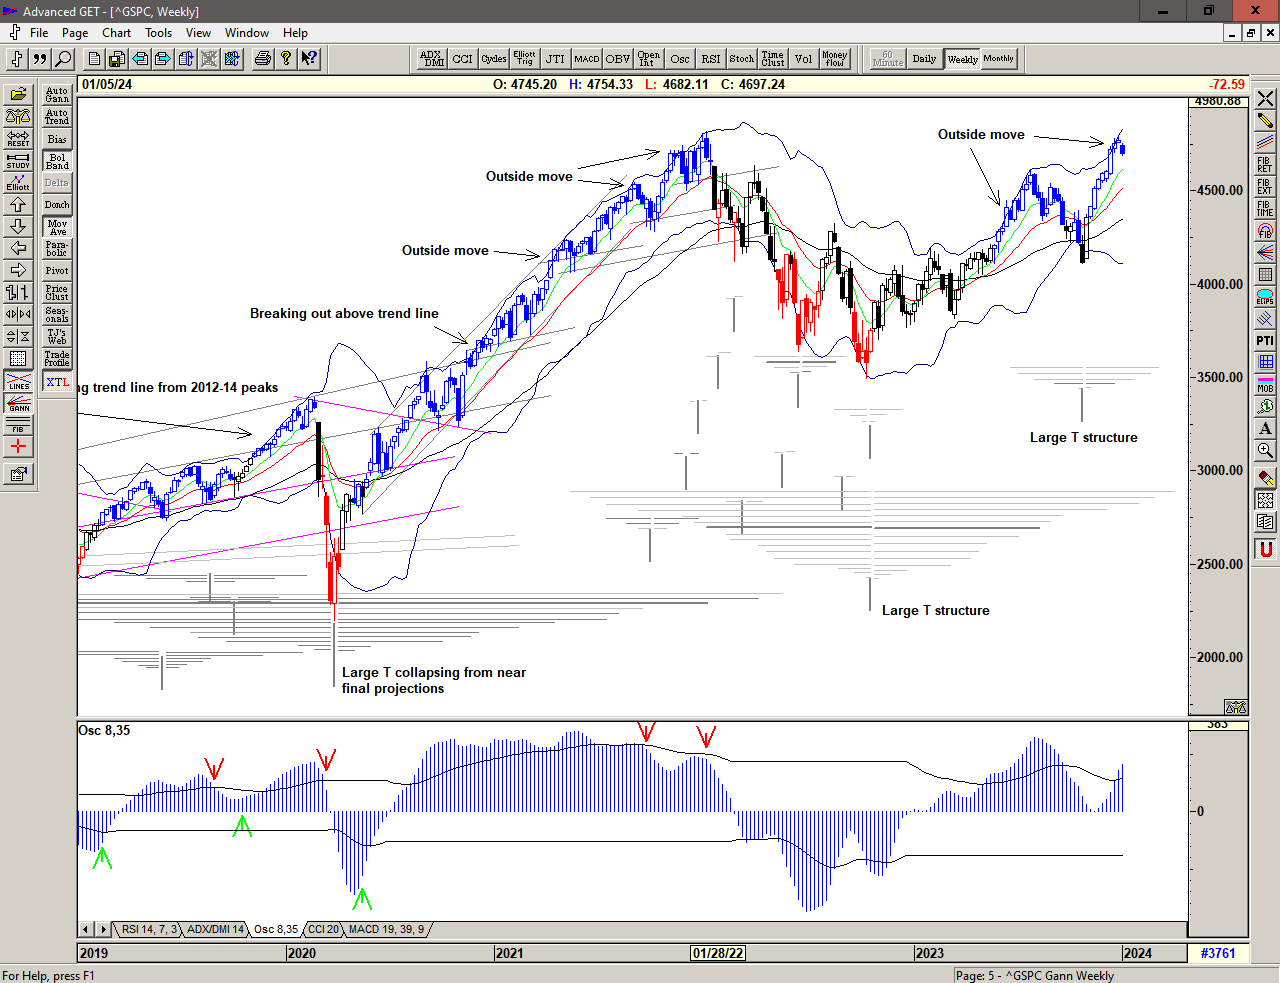
The T volume oscillator 1 is displaying weakness since the thrust into mid December, and this is associated with profit-taking. Given the strong rise we should expect marking out of the higher range with profit-taking, buying the dips and re-cycling as price looks for support and direction.

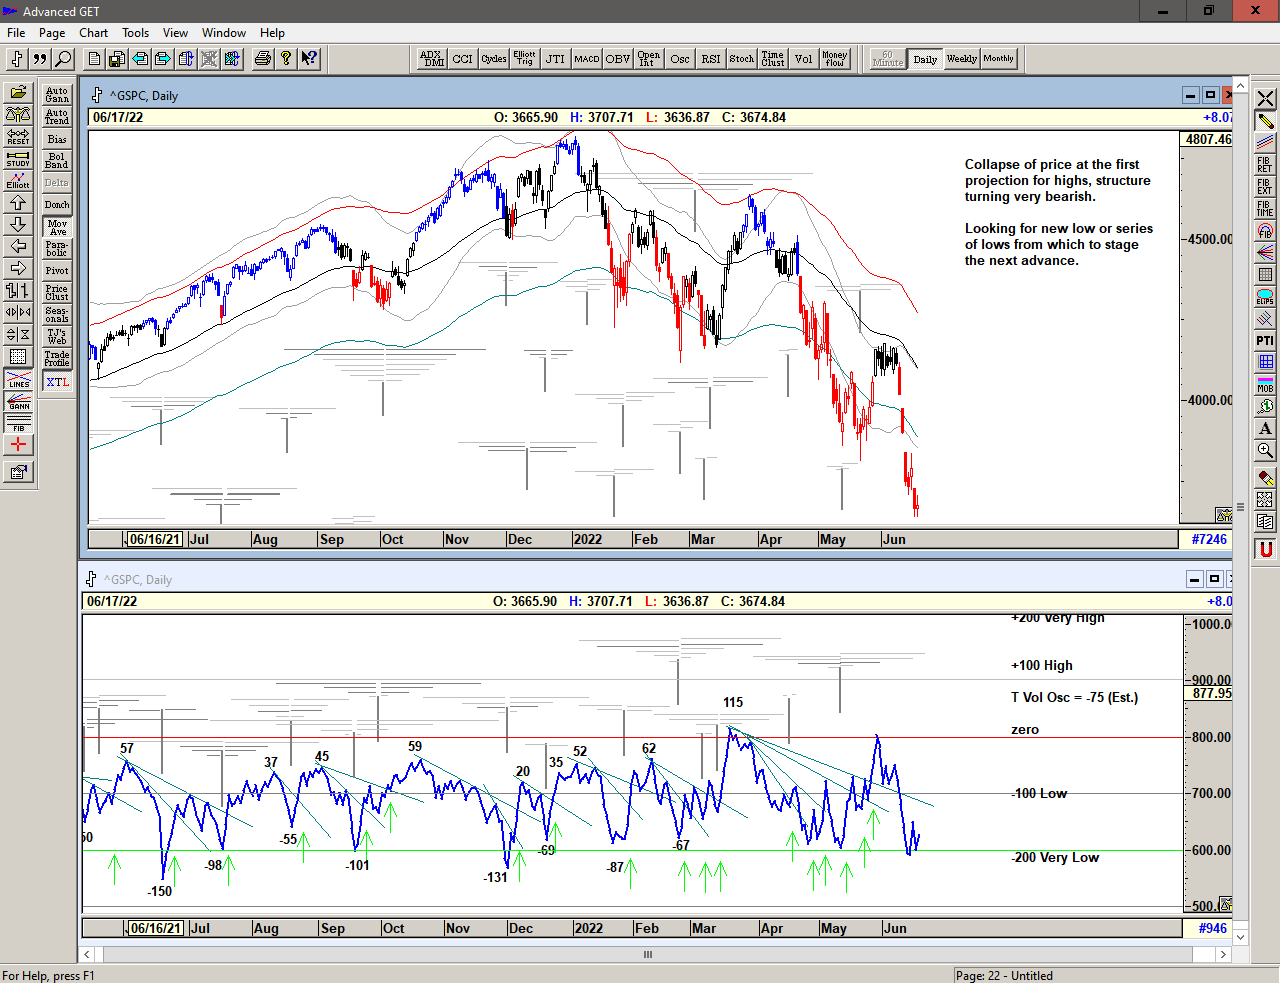
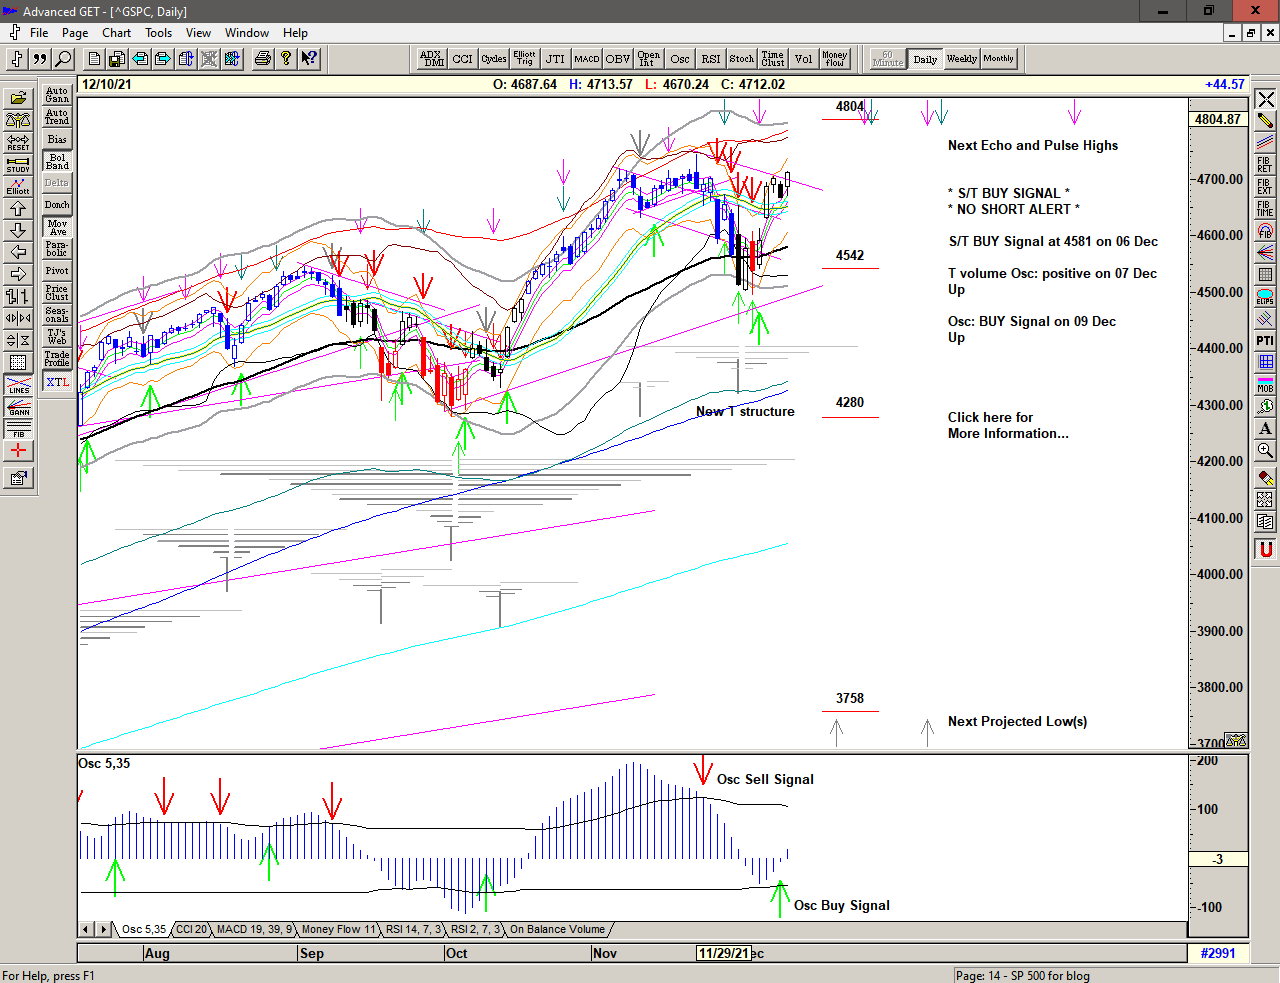
Having made an important high, the market is looking for the next low or series of lows from which to stage its next advance.

We are looking for price to move up (and hold) above the most recent short term price high and preferably close at or near the high of the day, and for the T volume oscillator to move upwards through the declining cash build up line 2 line to indicate the prescence of a new active T structure.

1 The T volume oscillator is an indication of Buying Power within the market as a whole
2 The cash build-up line is a declining line drawn above a series of lower highs made in the oscillator.

Weekly chart of S&P 500 for 08 January 2024

Save the image to your desktop to view a larger version

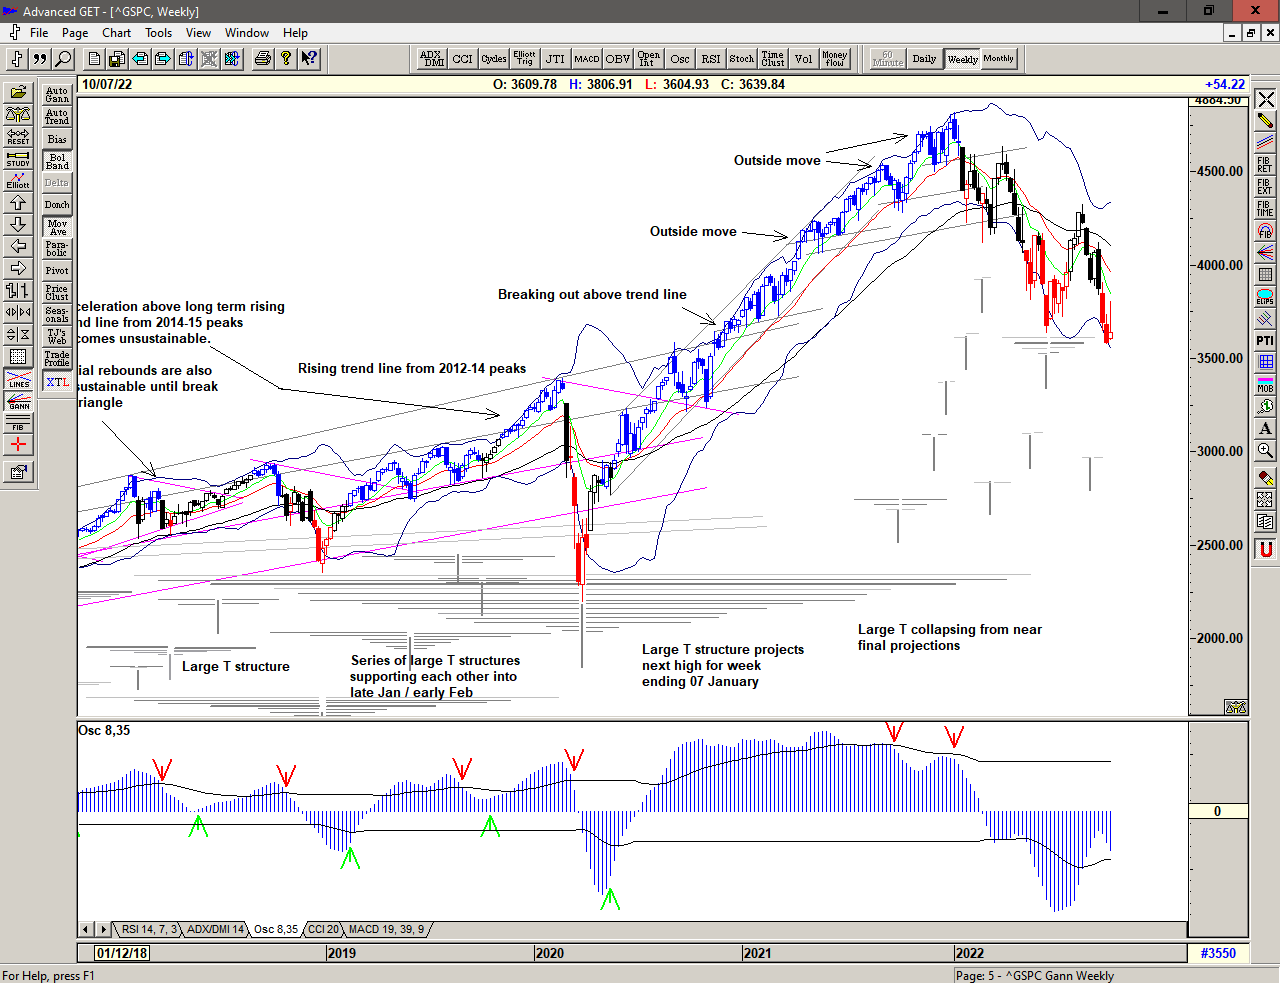
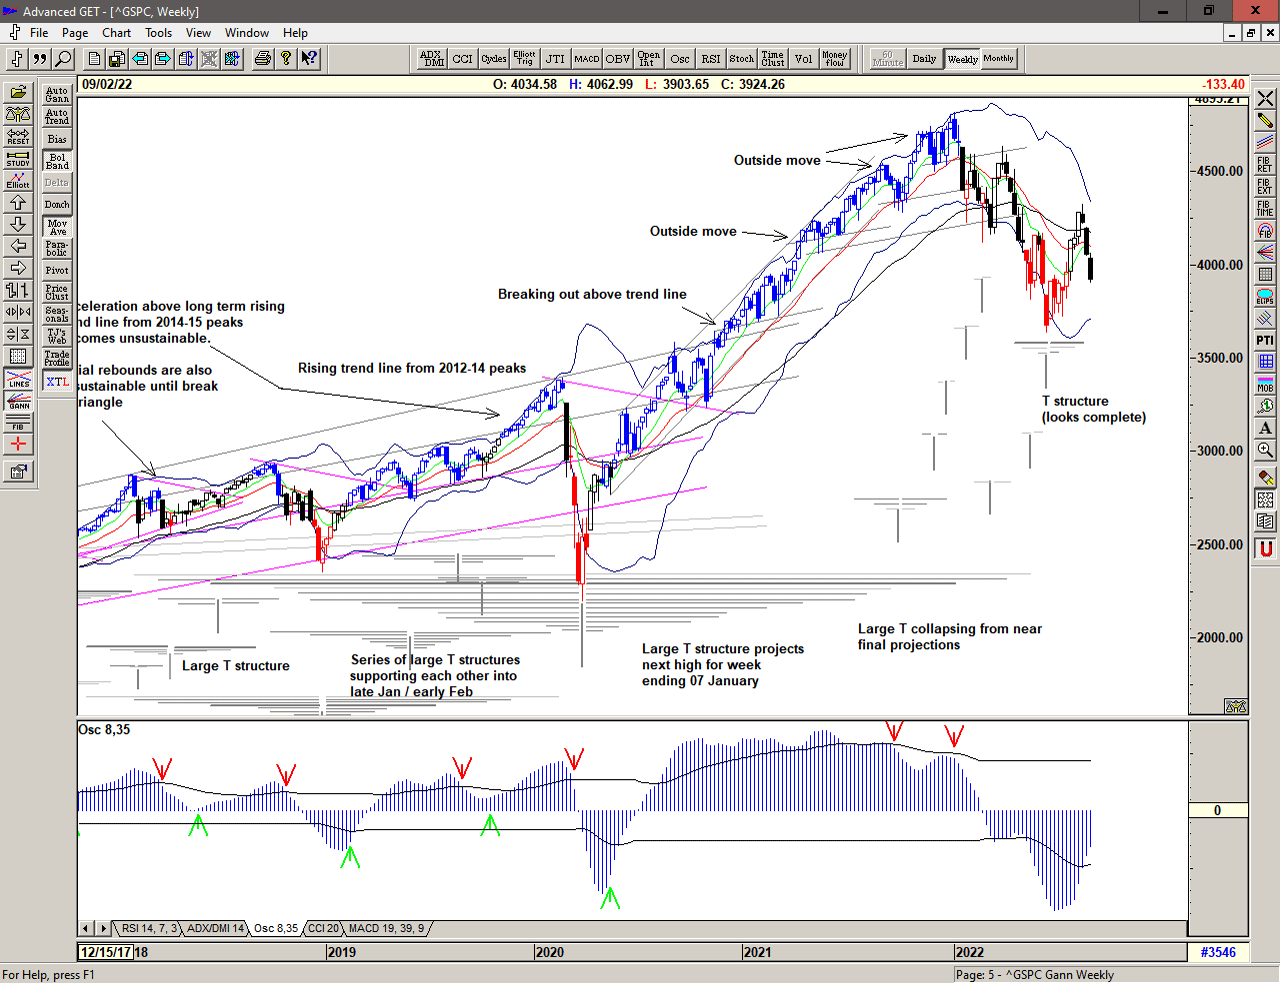
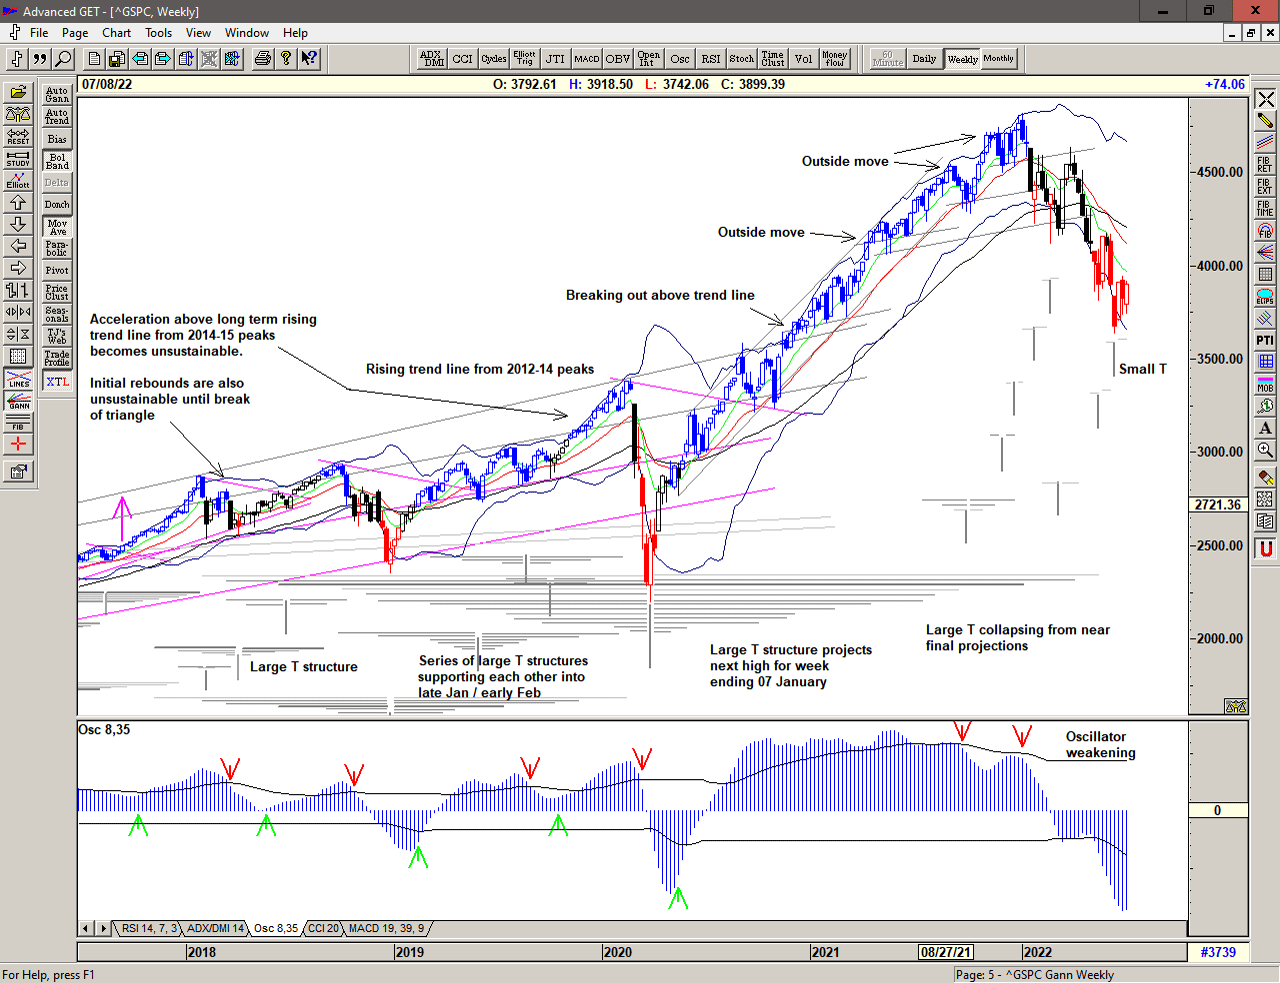
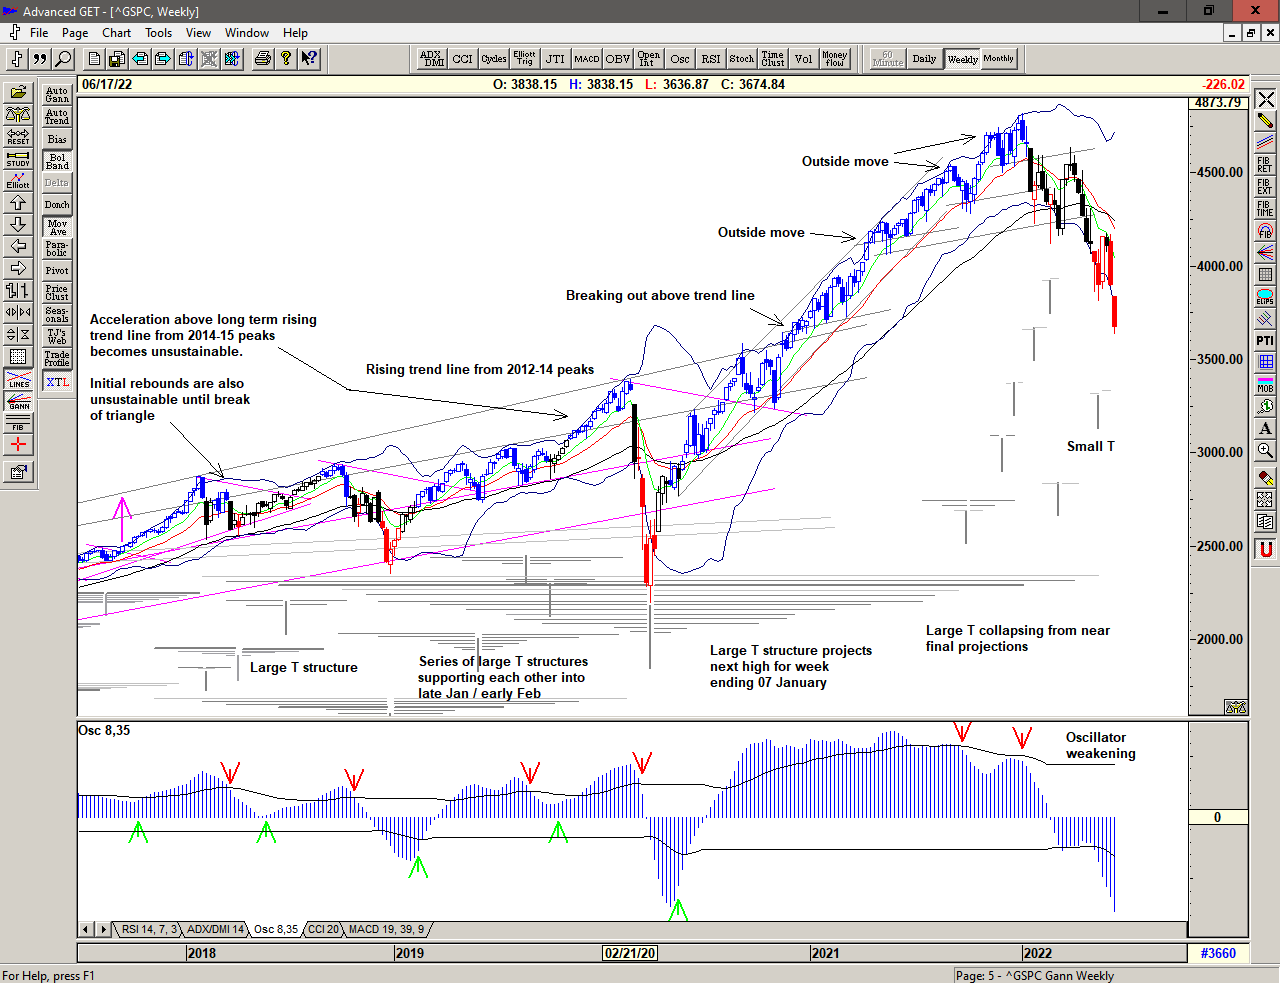
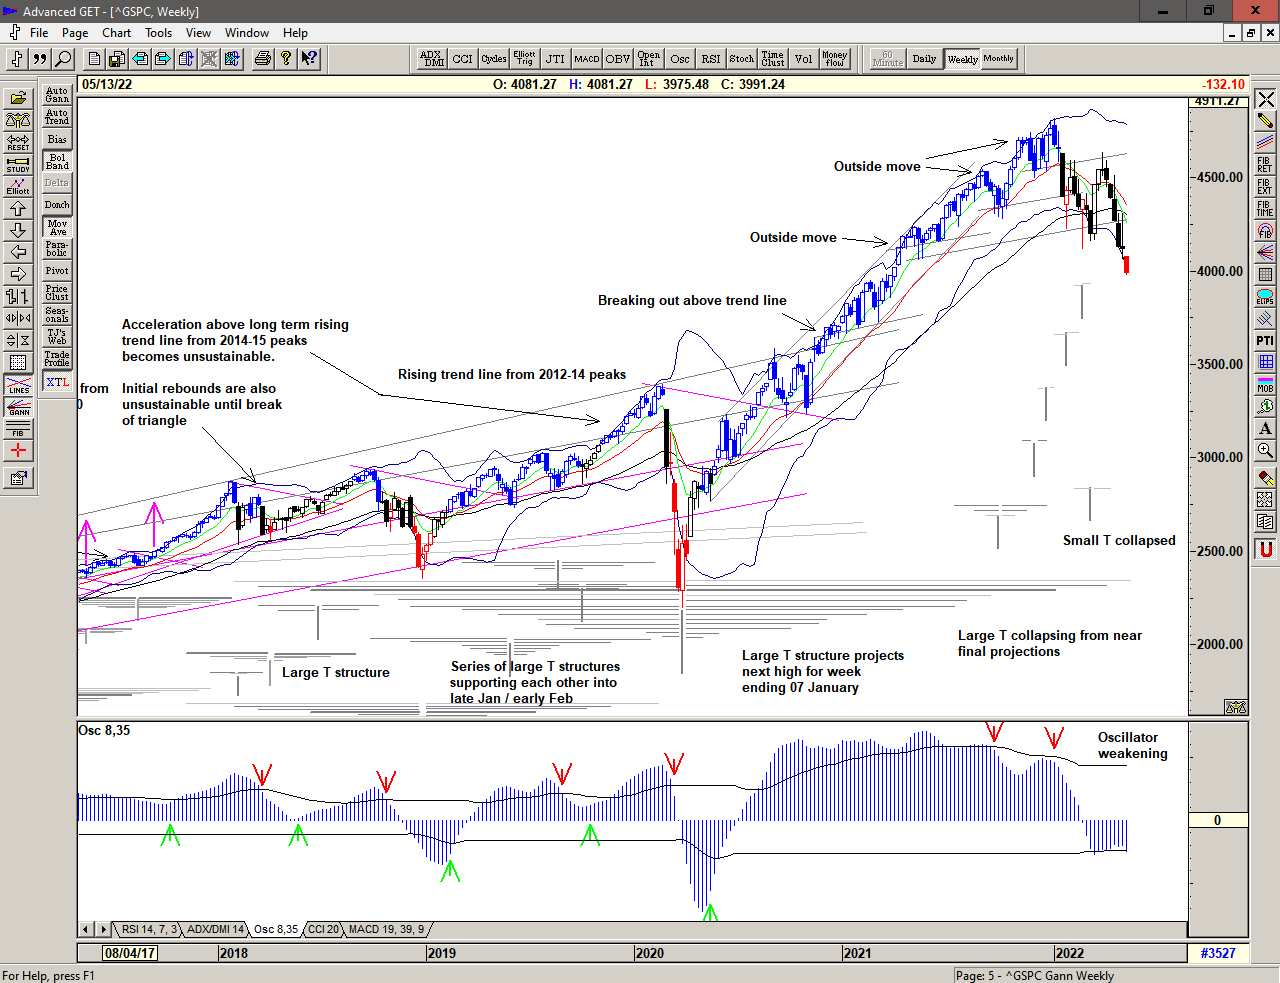
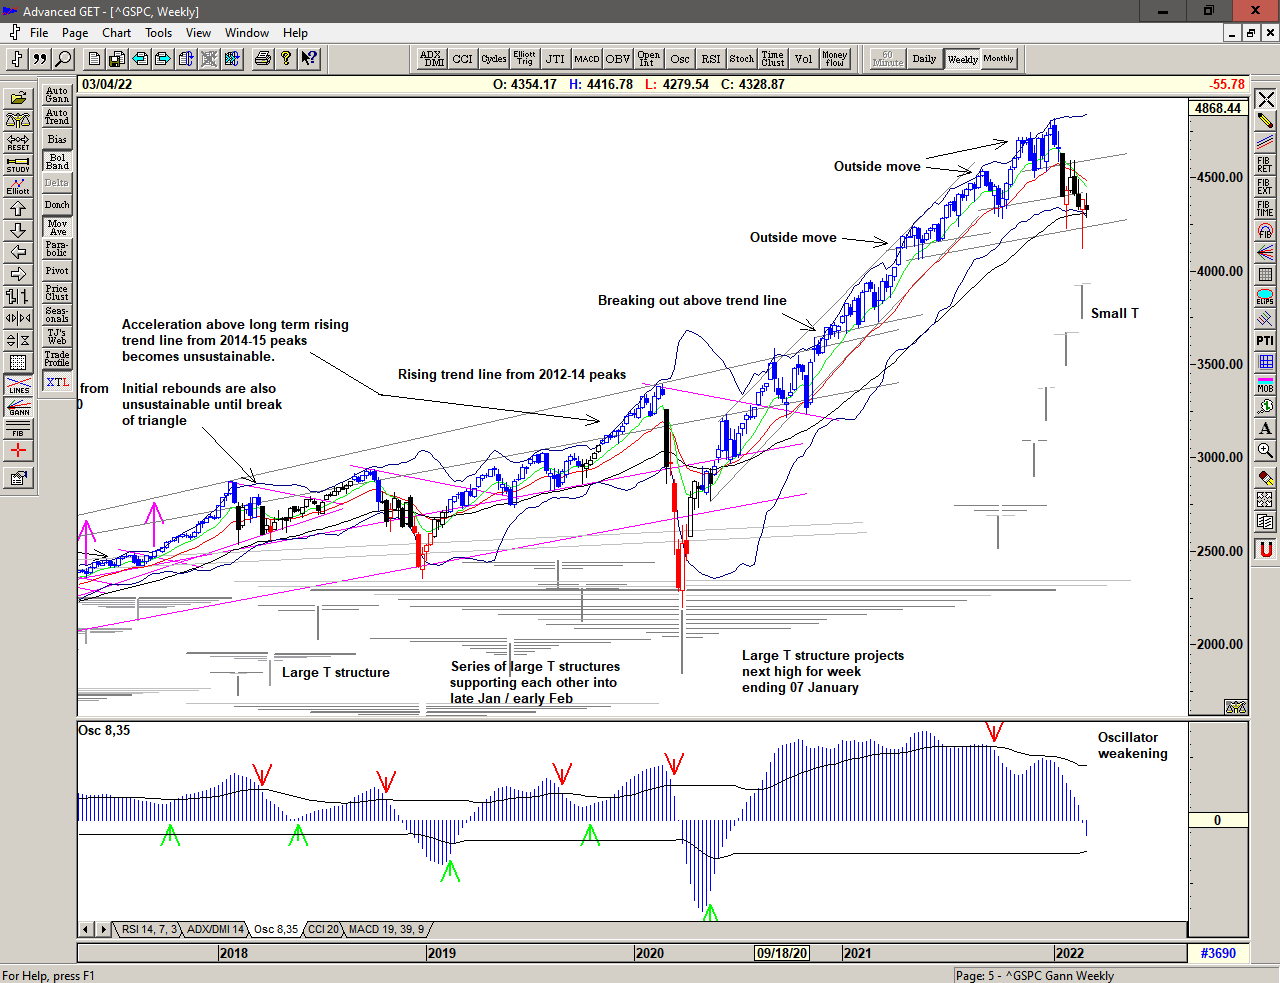
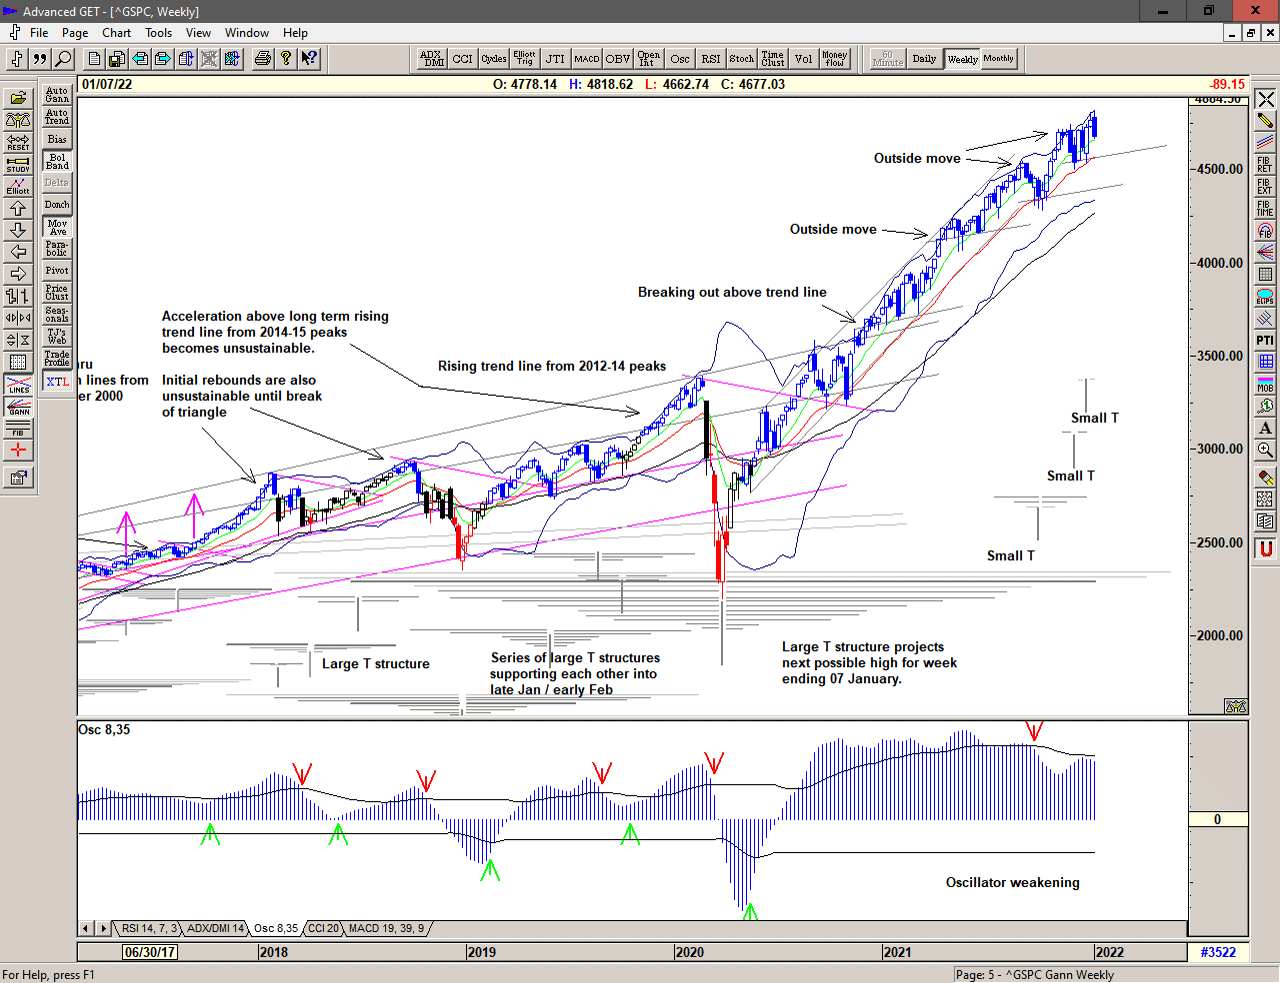
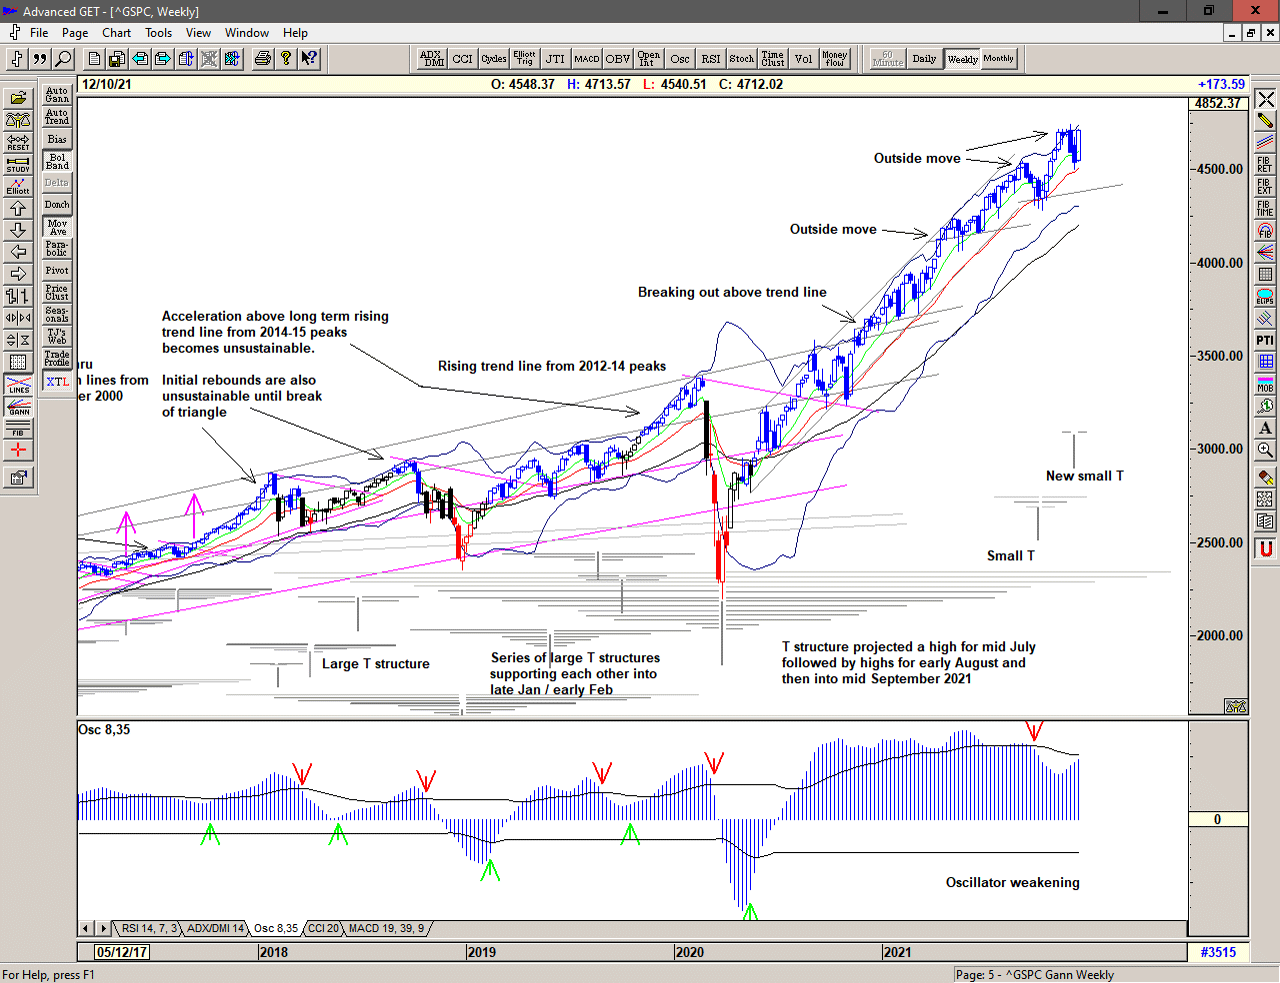
The weekly chart shows last week's dropping back since the outside move. A bit too far, a bit too quickly.

Monthly chart of S&P 500 for 08 January 2024

Save the image to your desktop to view a larger version

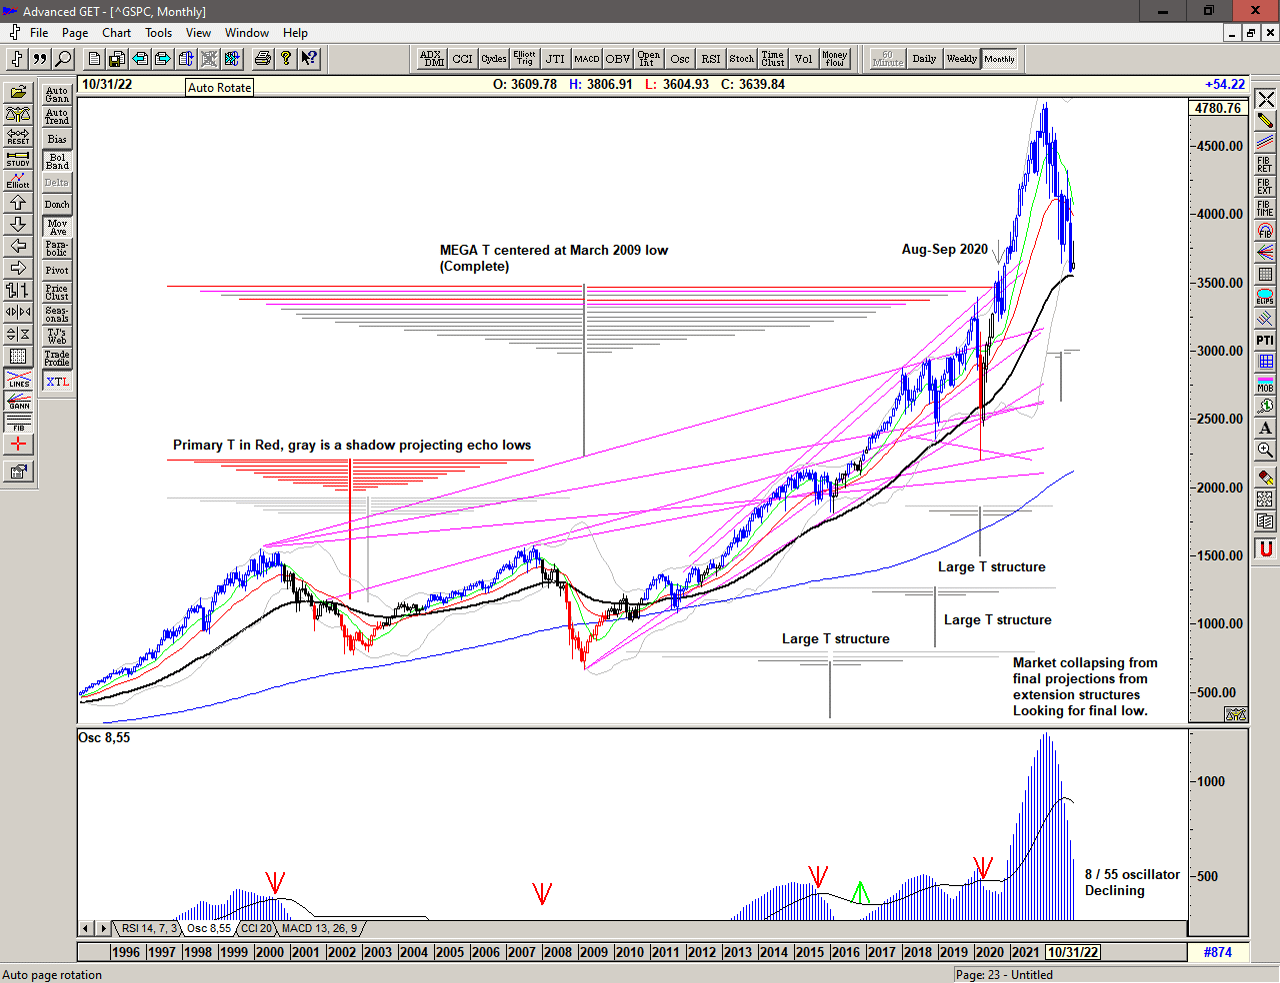
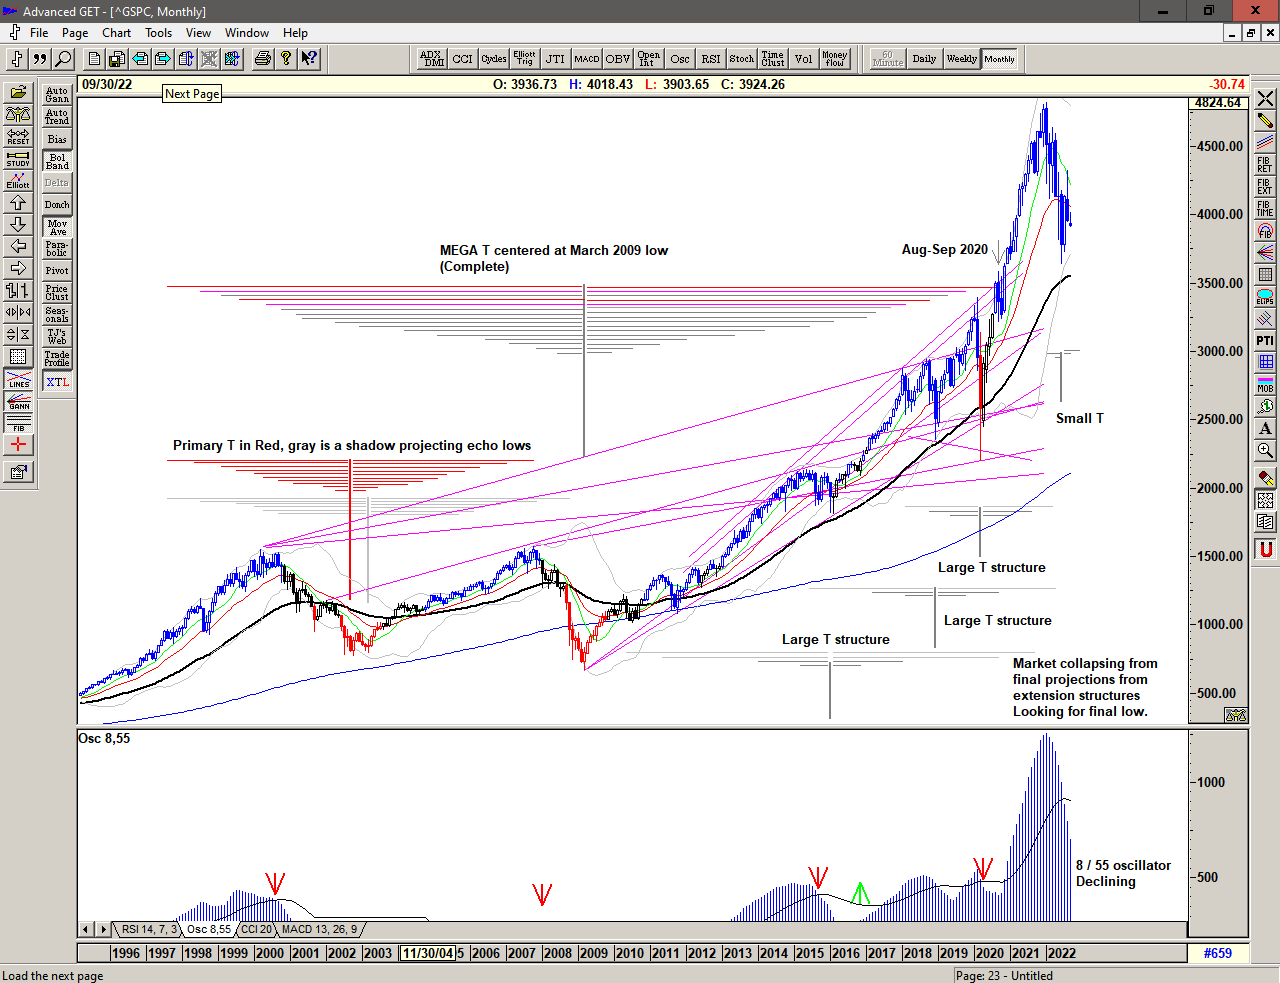
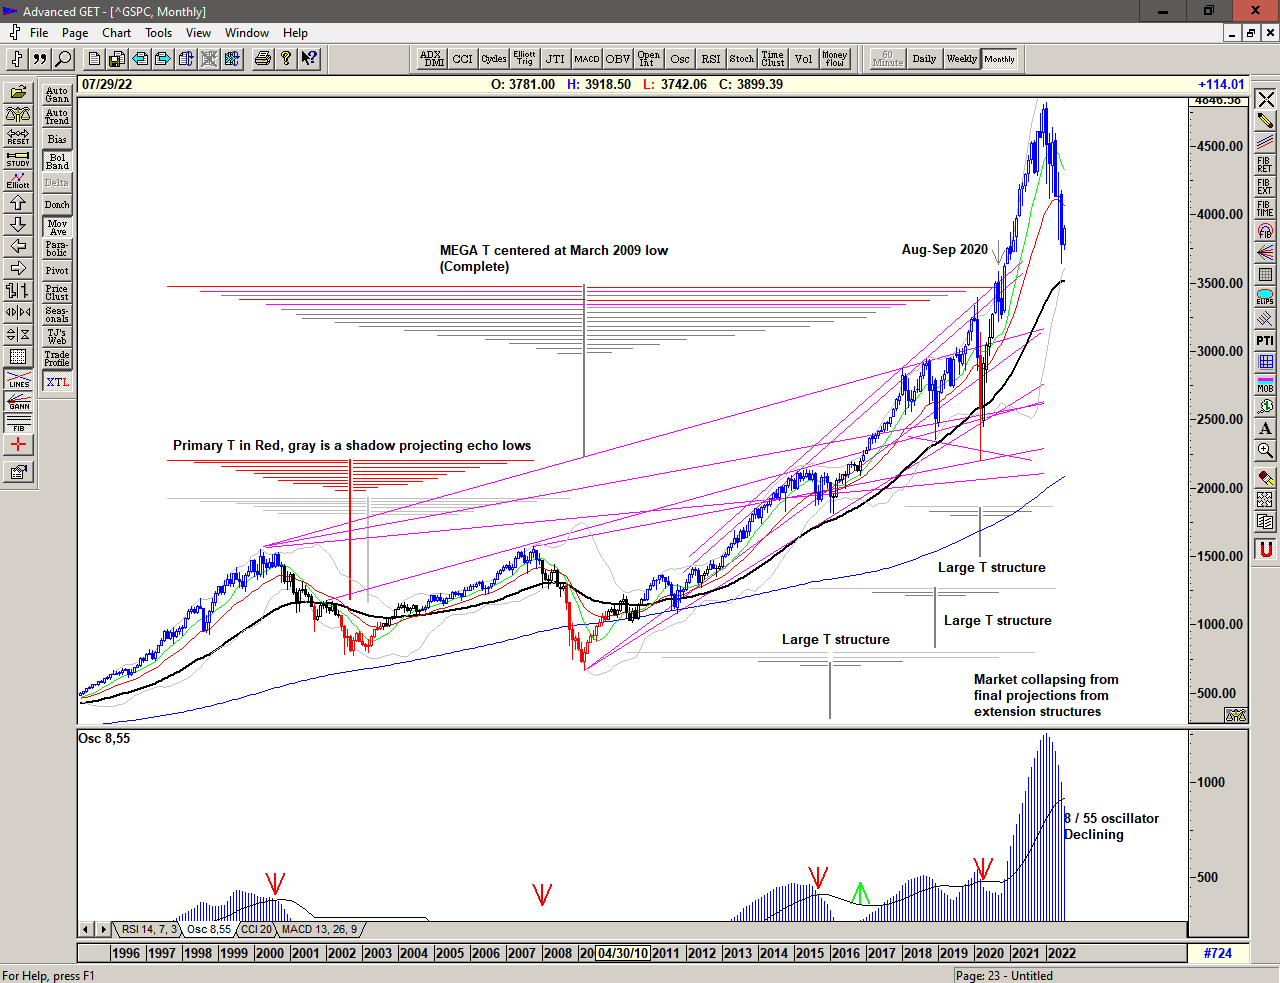
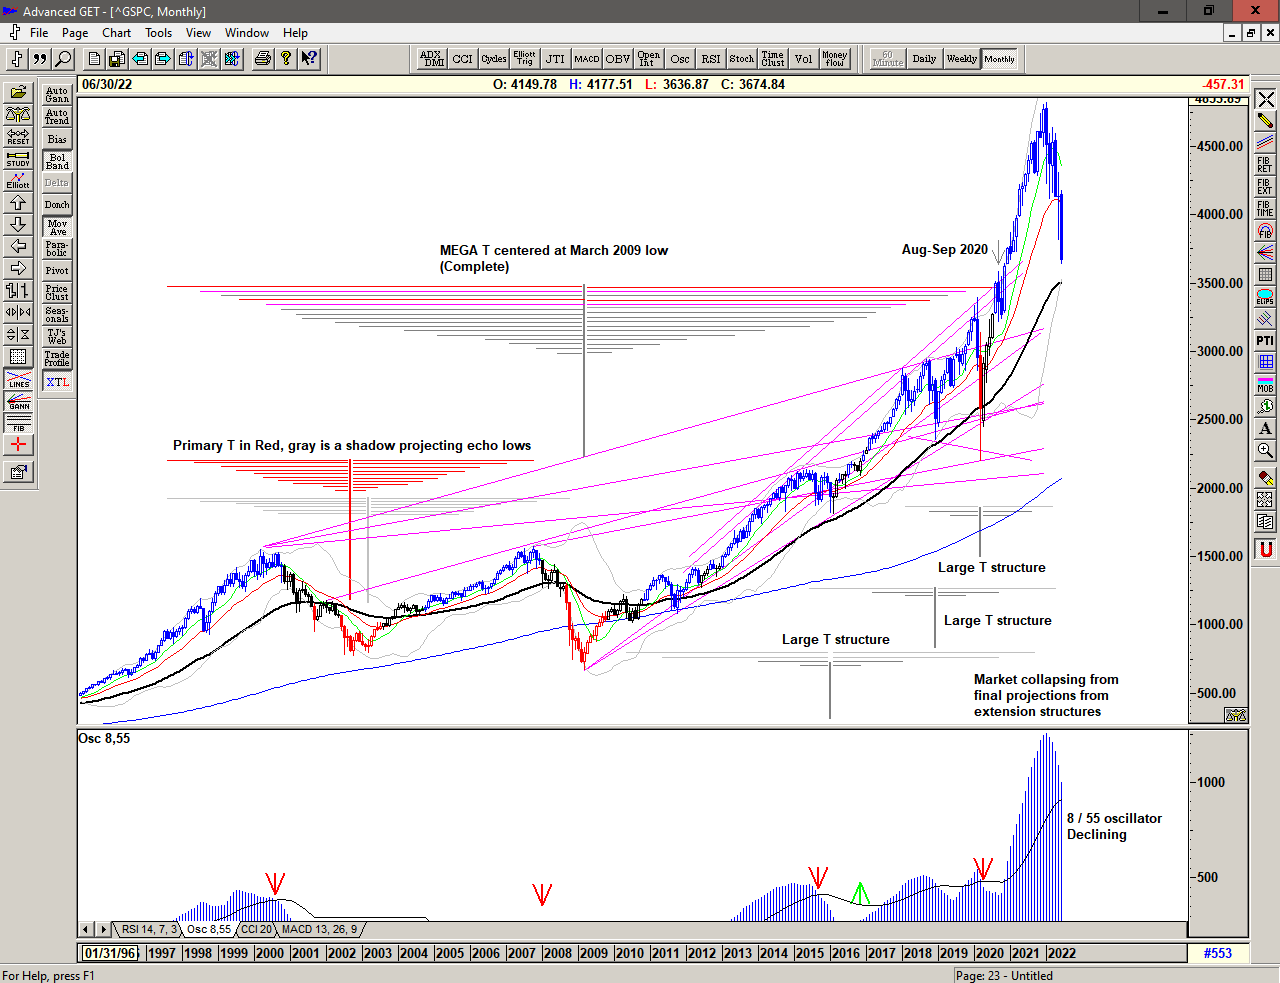
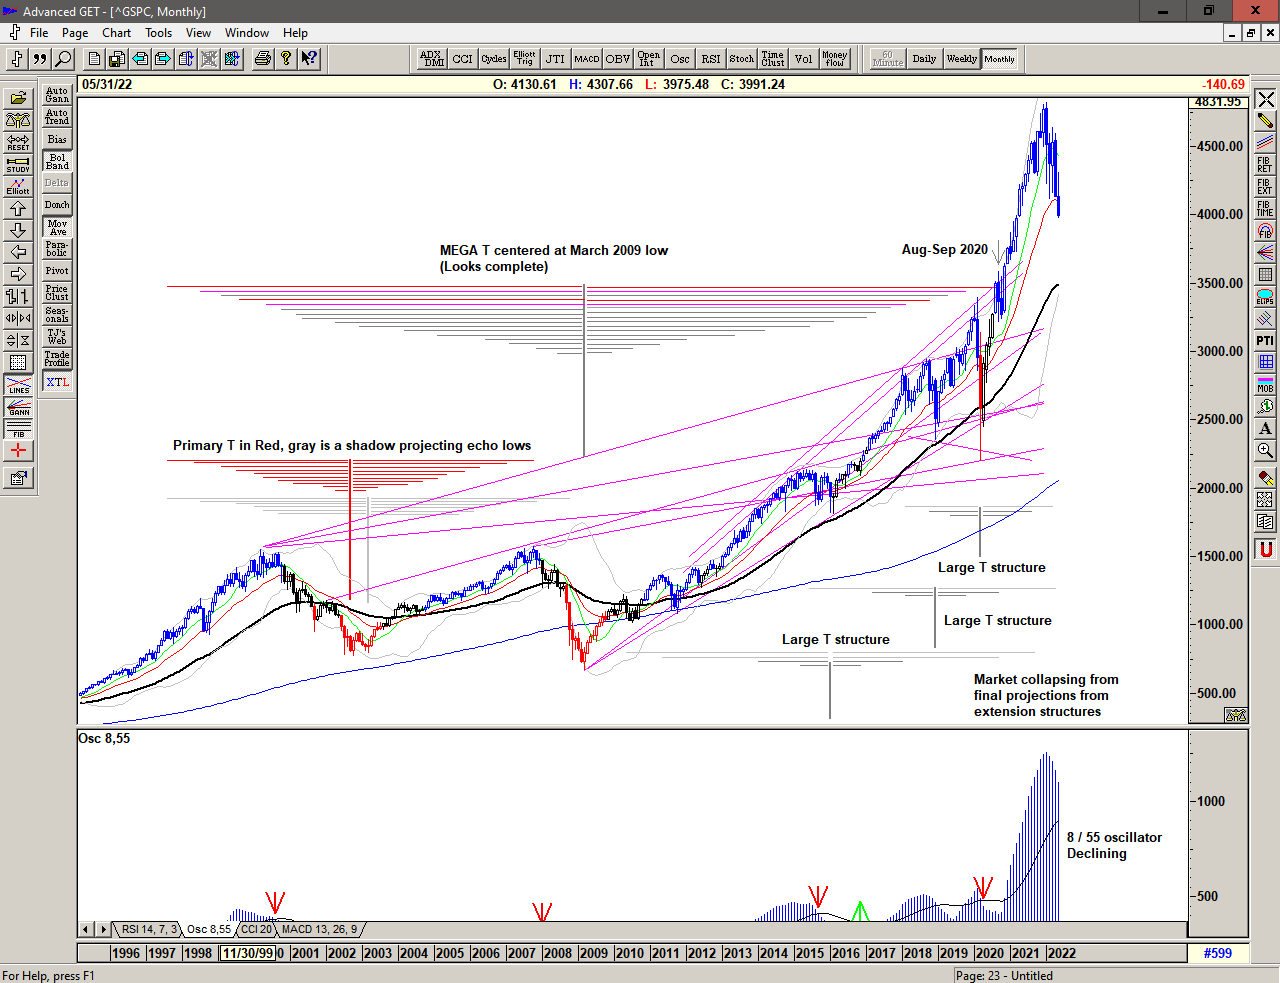
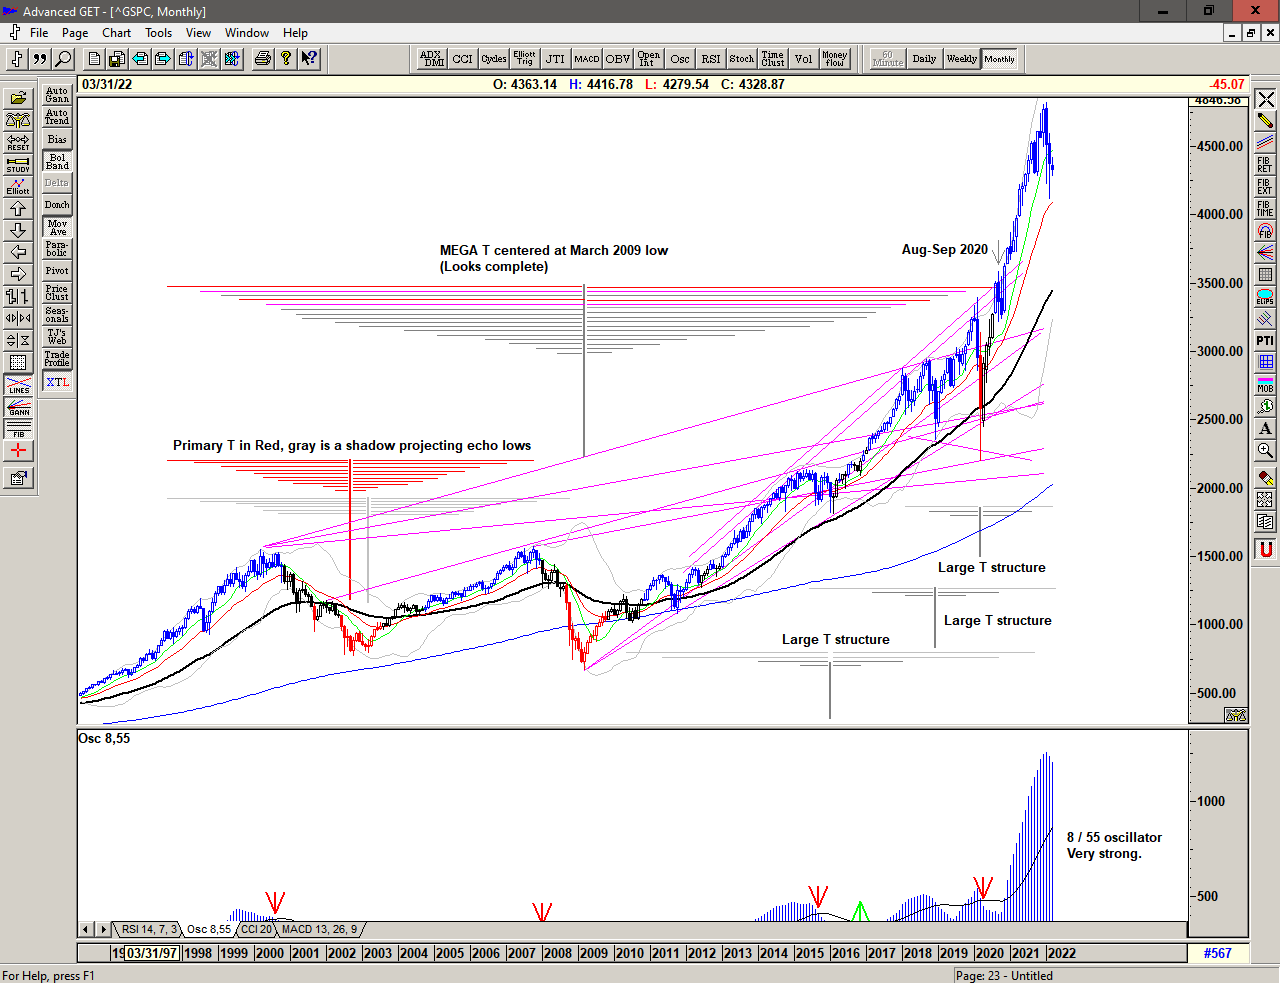
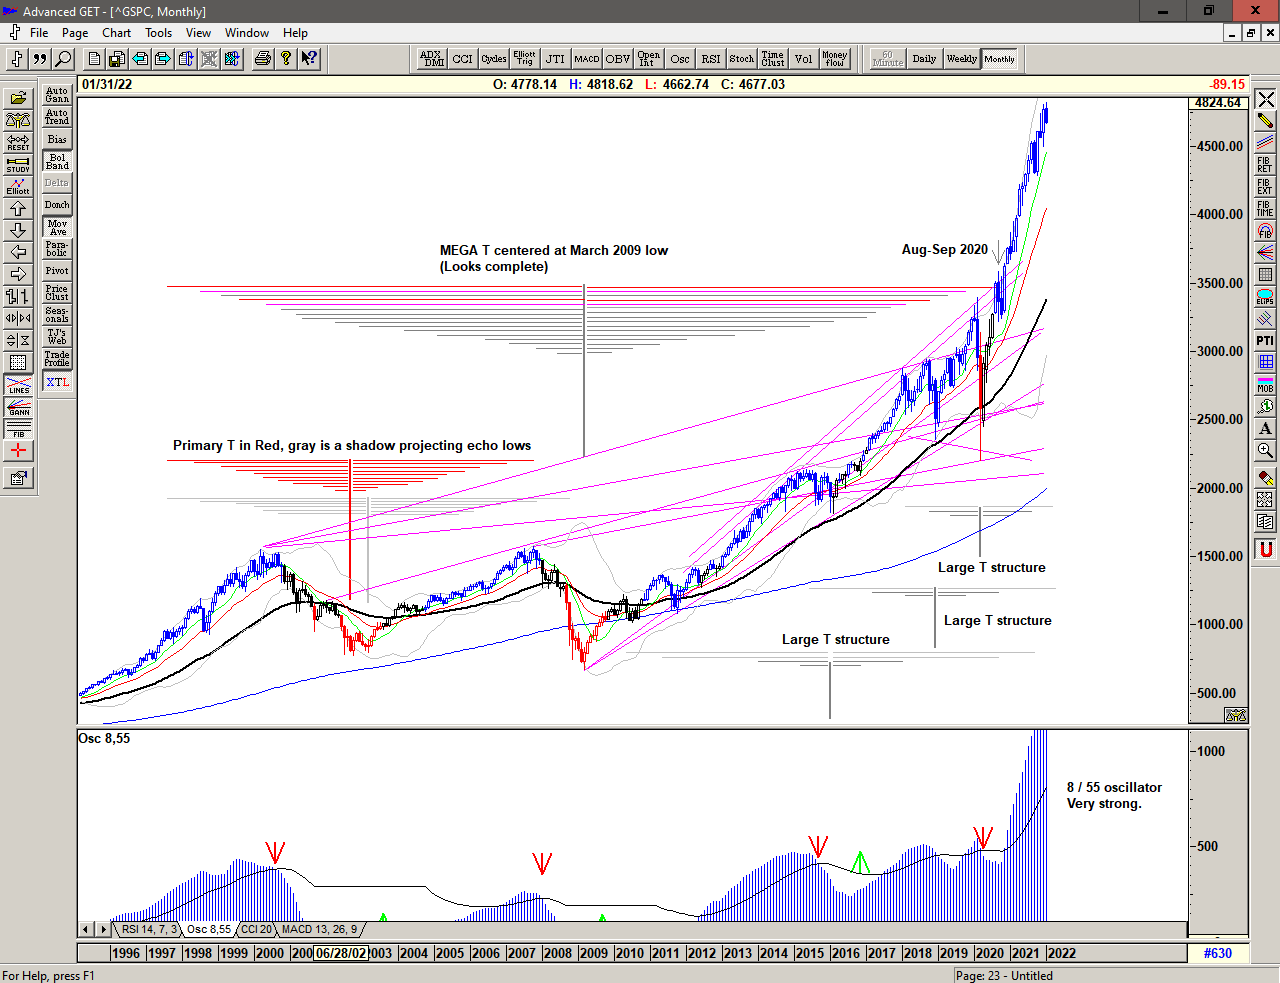
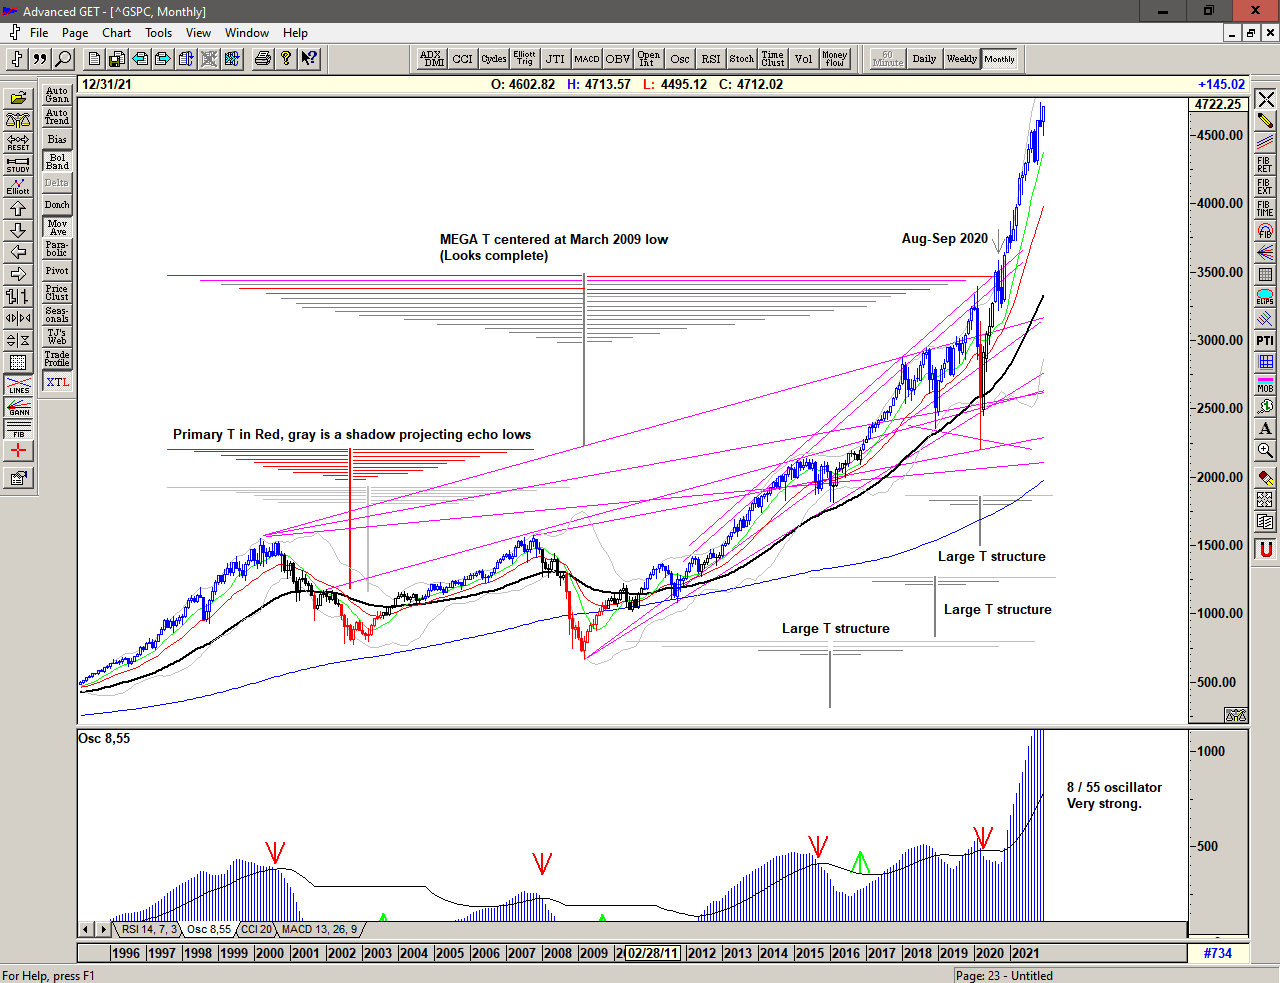
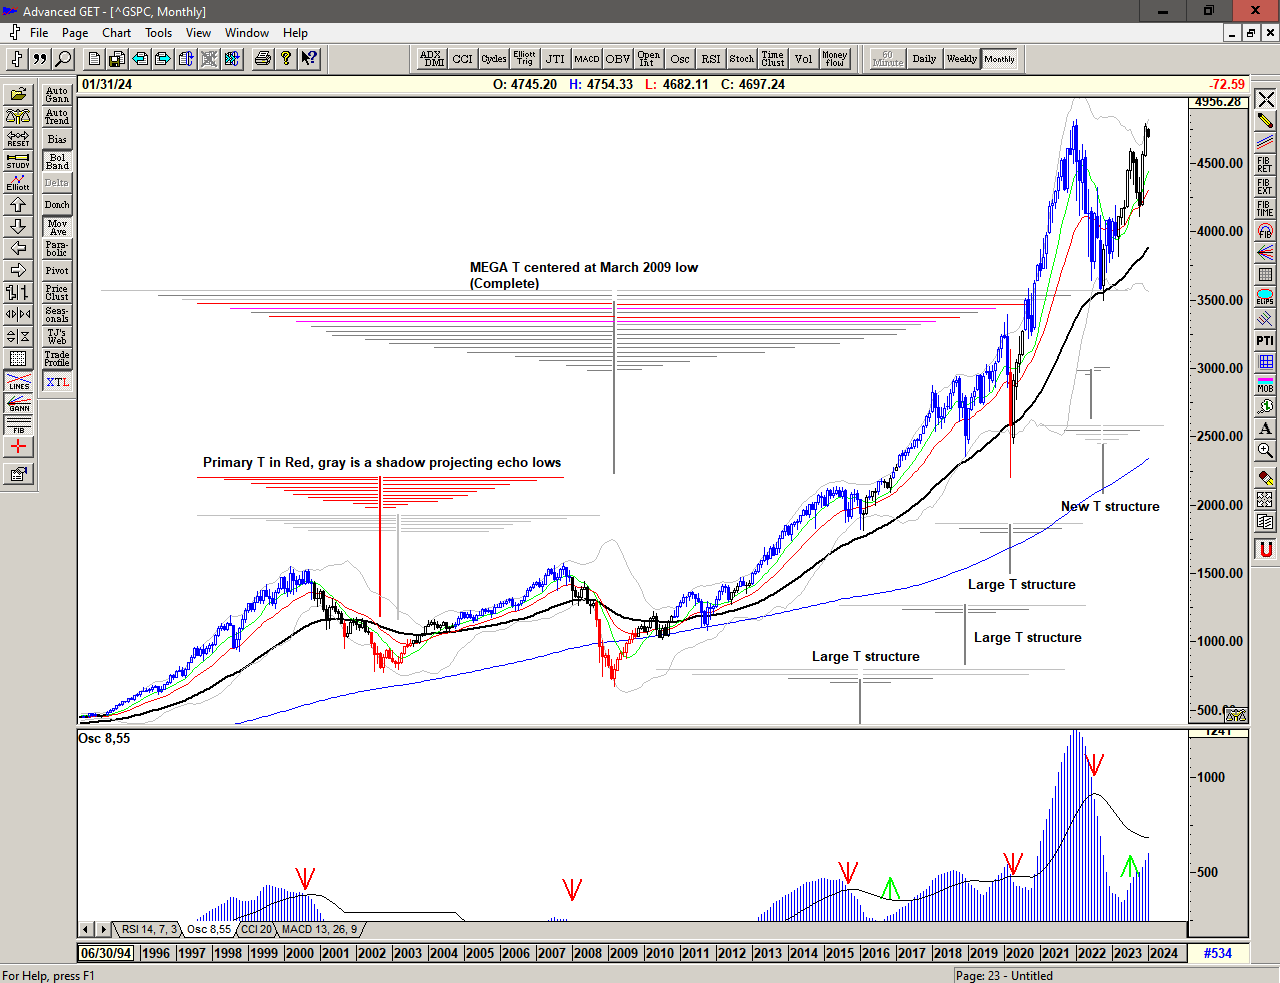
The monthly chart show the strong rise in the right hand side of a large T structure, drawing strength from the choppy decline since the December 21 high, and also from the huge rise post covid.

2024 starts with profit-taking but we should assume that strong expansive directional action will continue in both directions. This is a Brave New World and we should trade accordingly.

Regardless of whether the market can move higher or whether significant lows are ahead of us, the simplicity of the proprietary price based S/T Signalling System will continue to keep us on the correct side of the market, currently indicating a Cover Signal since 5 January above 4695.

If you would like to learn more about the S/T Signalling System , and using T Theory in your trading, please get in touch.

Be prepared for what is coming next and trade with confidence:

To receive detailed daily analysis, guidance and the updated daily Buy / Sell trigger levels being generated by the Trading the Line system before the market opens, please become a Member and Sign up for Daily Observations – includes access to Members Area and the 'Explanatory Notes' for all of the concepts discussed as well as the 'Notes on Daytrading' which provides insight into how to look for shorter term entries and exits within the context of the S/T Signalling System.

Karbala

All numbers refer to SPX

A quick Buy Signal with the early October bounce from 3585 is met with warnings of over-exuberance and subsequently fails with a rapid decline back towards the low, triggering another Sell Signal below 3711.

Daily chart of S&P 500 for 10 October 2022

Save the image to your desktop to view a larger version

Bearish and dangerous conditions continue with a new T structure collapsing as the market looks desperately for support at or near the previous low.

Chart of S&P 500 with T volume oscillator for 10 October 2022

Save the image to your desktop to view a larger version

The T volume oscillator 1 is again collapsing with price looking for support and continuing to indicate a distinct lack of buying power since the mid August high.

The market is looking for the next low from which to stage its next advance. This may be in the process of happening with the important 3600 area being challenged and tested. We should continue to expect rapid movement in either direction and selling into strength as the market looks to stabilize whilst making a decision on future longer term direction.

We are looking for price to move up (and hold) above the previous price high and preferably close at or near the high of the day, and for the T volume oscillator to move upwards through the declining cash build up line 2 line to indicate the prescence of a new T structure.

1 The T volume oscillator is an indication of Buying Power within the market as a whole
2 The cash build-up line is a declining line drawn above a series of lower highs made in the oscillator.

Weekly chart of S&P 500 for 10 October 2022

Save the image to your desktop to view a larger version

The weekly chart shows last week's collapse back towards the low of the previous week. Bearish action continues with the market attempting to place and hold a low at the breakout area of November 2020. Failure here would suggest a re-test of the September / October 2020 lows in the 3209-96 area.

Monthly chart of S&P 500 for 10 October 2022

Save the image to your desktop to view a larger version

The monthly chart show the ongoing collapse of the Mega T structure (and its extension higher into late 2021) as price comes to terms with the over-exuburance of 2020 and 2021 and attempts to find support. The continued decline suggests further weakness for now and we should therefore expect ongoing volatility within the context of a long term bearish market.

2022 continues with price dropping sharply from the top of a range that has become increasingly expansive since the move above 2500. With price again below the extremely volatile range from 4100-4600 we can only assume that this expansive price action will continue – in both directions – and that the important 2020 highs around 3385 and 3500 may still become the target. This is a Brave New World and we should trade accordingly.

Regardless of whether the market can move higher or whether significant lows are ahead of us, the simplicity of the proprietary price based S/T Signalling System will continue to keep us on the correct side of the market, currently indicating a Sell Signal since 06 October below 3711.

If you would like to learn more about the S/T Signalling System , and using T Theory in your trading, please get in touch.

Sign up here for daily analysis with the updated Buy / Sell trigger levels being generated by the Trading the Line S/T System before the market opens. Trading the Line Membership – includes Explanatory Notes (pdf), Notes on Day Trading (pdf) and End of Day Snapshot of Day Trading Entries.

Disclaimer: This is the diary of a personal trading system, its methodology and the signals that it is producing. You are welcome to follow along but please understand that the information presented here is for educational purposes only. No recommendations are being made to buy, or sell stocks, options or futures contracts. Please consult your own financial advisor before making any investment decisions.


Labor

All numbers refer to SPX

The market is back in the mode of selling strength since the 16 August high with yet another very rapid reversal at the end of the summer. A quick look up on Friday triggering a Cover Short Signal at 3997 and just triggering an S/T Buy Signal at 4017 before being met with strong selling and a rapid decline reactivating the Sell Signal at and below 3997.

An S/T Sell Signal at 3997.

Dangerous market conditions.

Daily chart of S&P 500 for 06 September 2022

Save the image to your desktop to view a larger version

The strong Buy Signal just after the secondary low on 14 July set up the recovery into the projections for a high from the T structures with price regaining the important 4300 area, albeit only temporarily.

4300 has become a pivot with previous important support becoming important resistance as we see price dropping away again into the end of the summer.

Chart of S&P 500 with T volume oscillator for 06 September 2022

Save the image to your desktop to view a larger version

The T volume oscillator 1 is again collapsing with price looking for support and indicating a distinct lack of buying power since the mid August high.

The market is looking for the next low from which to stage its next advance. This may be in the process of happening with the important 3900 area being challenged and tested. We should continue to expect rapid movement in either direction and selling into strength as the market looks to stabilize whilst making a decision on future longer term direction.

We are looking for price to move up (and hold) above the previous price high and preferably close at or near the high of the day, and for the T volume oscillator to move upwards through the declining cash build up line 2 line to indicate the prescence of a new T structure.

1 The T volume oscillator is an indication of Buying Power within the market as a whole
2 The cash build-up line is a declining line drawn above a series of lower highs made in the oscillator.

Weekly chart of S&P 500 for 06 September 2022

Save the image to your desktop to view a larger version

The weekly chart shows the rapid decline from the 4300 area with the collapse of the T structure. The weakness is suggesting another re-test of the May – July lows – 3638-3800 and possibly lower in due course.

Monthly chart of S&P 500 for 06 September 2022

Save the image to your desktop to view a larger version

The monthly chart show the ongoing collapse of the Mega T structure (and its extension higher into late 2021) as price comes to terms with the over-exuburance of 2020 and 2021 and attempts to find support. The continued decline suggests further weakness for now and we should therefore expect ongoing volatility within the context of a long term bearish market.

2022 continues with price dropping sharply from the top of a range that has become increasingly expansive since the move above 2500. With price again below the extremely volatile range from 4100-4600 we can only assume that this expansive price action will continue – in both directions – and that the important 2020 highs around 3385 and 3500 may still become the target. This is a Brave New World and we should trade accordingly.

Regardless of whether the market can move higher or whether significant lows are ahead of us, the simplicity of the proprietary price based S/T Signalling System will continue to keep us on the correct side of the market, currently indicating a Buy Signal since 15 July at 3828.

If you would like to learn more about the S/T Signalling System , and using T Theory in your trading, please get in touch.

Be prepared for what is coming next and trade with confidence:

Sign up here for daily analysis with the updated Buy / Sell trigger levels being generated by the Trading the Line S/T System before the market opens. Trading the Line Membership – includes Explanatory Notes (pdf), Notes on Day Trading (pdf) and End of Day Snapshot of Day Trading Entries.

Disclaimer: This is the diary of a personal trading system, its methodology and the signals that it is producing. You are welcome to follow along but please understand that the information presented here is for educational purposes only. No recommendations are being made to buy, or sell stocks, options or futures contracts. Please consult your own financial advisor before making any investment decisions.

Cremera

All numbers refer to SPX

Strong buying from Friday's open triggering an S/T Buy Signal at / above 3828 and remaining strong for the rmainder of the day.

An oscillator Buy Signal and a new small T.

Buy Signal active.

Daily chart of S&P 500 for 18 July 2022

Save the image to your desktop to view a larger version

A third attempt to recover the June losses, perhaps the beginings of a more sustainable advance from a higher low?

As we saw recently, there is a major 'pivot' in the 3900 area which may well need some more working off, but strength above this area should unleash considerable buying power and the possibility of another attempt on 4175.

Chart of S&P 500 with T volume oscillator for 18 July 2022

Save the image to your desktop to view a larger version

The T volume oscillator 1 made a strong Buy Signal in the days after the June low, with a 'w' pattern and a movement in the oscillator upwards through a steep cash build up line 2.

It looks like we are seeing a similar phenomenon since the reversal low on 14 July with a new small T, suggesting that there is a larger structure under construction.

Given the bearish price action of the last few months, we should look for the market to take out the previous high with strength.

When that occurs we should see a significant lasting move back higher.

We are therefore prepared for a recovery but still mindful of the potential for lower prices from this level.

1 The T volume oscillator is an indication of Buying Power within the market as a whole
2 The cash build-up line is a declining line drawn above a series of lower highs made in the oscillator.

Weekly chart of S&P 500 for 11 July 2022

Save the image to your desktop to view a larger version

The weekly chart shows the market attempting to hold support at the breakout level 3580-3620.

Further strength would suggest that we may now be seeing a final low and that there is a larger T under construction.

Monthly chart of S&P 500 for 11 July 2022

Save the image to your desktop to view a larger version

The monthly chart continues to show the collapse from the Large structures which extended the Mega Structure into 2022. Not much to go on but holding up above the June close of 3785 is a good sign with 4000 an important area to proceed beyond if the bull market is to resume.


2022 continues with price dropping sharply from the top of a range that has become increasingly expansive since the move above 2500. With price below the extremely volatile range from 4100-4600 we can only assume that this expansive price action will continue – in both directions – and that the important 2020 highs around 3385 and 3500 may still become the target. This is a Brave New World and we should trade accordingly.

Regardless of whether the market can move higher or whether significant lows are ahead of us, the simplicity of the proprietary price based S/T Signalling System will continue to keep us on the correct side of the market, currently indicating a Buy Signal since 15 July at 3828.

Although the market is keeping me extremely busy, I intend to launch a Mentoring Service in 2022 that will complement and expand upon the Trading the Line Subscription Service. Topics will include: T Theory, Position Trading, Day Trading, Price action, and Trading Psychology, and the intention is to provide traders with the full educational support that they may need to become successful.

If you would like to learn more about the S/T Signalling System , using T Theory or would be interested in the Mentoring Service , please get in touch.

Be prepared for what is coming next and trade with confidence:

Sign up here for daily analysis with the updated Buy / Sell trigger levels being generated by the Trading the Line S/T System before the market opens. Trading the Line Membership – includes Explanatory Notes (pdf), Notes on Day Trading (pdf) and End of Day Snapshot of Day Trading Entries.

Disclaimer: This is the diary of a personal trading system, its methodology and the signals that it is producing. You are welcome to follow along but please understand that the information presented here is for educational purposes only. No recommendations are being made to buy, or sell stocks, options or futures contracts. Please consult your own financial advisor before making any investment decisions.

Mockingbird

All numbers refer to SPX

The sharp shake out drop after Independence is bought with a renewed S/T Buy Signal at 3809 pushing up into the previous highs just above 3900.

Daily chart of S&P 500 for 11 July 2022

Save the image to your desktop to view a larger version

A second attempt to recover the June losses, perhaps the beginings of a more sustainable advance from a higher low.

For now there is a major 'pivot' in the 3900 area which may well need some more working off, but strength above this area should unleash considerable buying power and the possibility of another attempt on 4175.

Chart of S&P 500 with T volume oscillator for 11 July 2022

Save the image to your desktop to view a larger version

The T volume oscillator 1 made a strong Buy Signal in the days after the June low, with a 'w' pattern and a movement in the oscillator upwards through a steep cash build up line 2.

The stabilization and retracement of the late June decline suggests that that Buy Signal is still active.

Given the bearish price action of the last few months, we should look for the market to take out the previous high with strength.

When that occurs we should see a significant lasting move back higher.

We are therefore prepared for a recovery but still mindful of the potential for lower prices from this level.

1 The T volume oscillator is an indication of Buying Power within the market as a whole
2 The cash build-up line is a declining line drawn above a series of lower highs made in the oscillator.

Weekly chart of S&P 500 for 11 July 2022

Save the image to your desktop to view a larger version

The weekly chart continues to provide a bigger picture of the Large structure centered at the March 2020 low and projected the important early January high from the price peak in mid June 2018.

The collapse of this structure with price stepping lower from subsequent attempts to recover has looked increasingly bearish, but the recent attempt to hold above the low at 3636 is looking more promising.

We are of course looking at the left-hand side of a large T structure, still in its early development with its center yet to be confirmed. Holding onto weekly and then monthly gains would be required to change that perspective and would activate considerable power to the upside.

Monthly chart of S&P 500 for 11 July 2022

Save the image to your desktop to view a larger version

The monthly chart shows the series of Large structures that were collectively projecting highs for March and April 2022 and were extending the much larger Mega T structure. The collapse from the New Year high was rather ominous and was suggesting that the projections came in a little early, in which case the market has been looking for an important low or series of lows for the next larger structure.

Although last month's spike low is encouraging, we may need to see further tests or a deeper low in due course.

2022 continues with price dropping sharply from the top of a range that has become increasingly expansive since the move above 2500. With price moving below the extremely volatile range from 4100-4600 we can only assume that this expansive price action will continue – in both directions – and that the important 2020 highs around 3385 and 3500 may still become the target. This is a Brave New World and we should trade accordingly.

Regardless of whether the market can move higher or whether significant lows are ahead of us, the simplicity of the proprietary price based S/T Signalling System will continue to keep us on the correct side of the market, currently indicating a Buy Signal since 05 July at 3809.

Although the market is keeping me extremely busy, I intend to launch a Mentoring Service in 2022 that will complement and expand upon the Trading the Line Subscription Service. Topics will include: T Theory, Position Trading, Day Trading, Price action, and Trading Psychology, and the intention is to provide traders with the full educational support that they may need to become successful.

If you would like to learn more about the S/T Signalling System , using T Theory or would be interested in the Mentoring Service , please get in touch.

Be prepared for what is coming next and trade with confidence:

Sign up here for daily analysis with the updated Buy / Sell trigger levels being generated by the Trading the Line S/T System before the market opens. Trading the Line Membership – includes Explanatory Notes (pdf), Notes on Day Trading (pdf) and End of Day Snapshot of Day Trading Entries.

Disclaimer: This is the diary of a personal trading system, its methodology and the signals that it is producing. You are welcome to follow along but please understand that the information presented here is for educational purposes only. No recommendations are being made to buy, or sell stocks, options or futures contracts. Please consult your own financial advisor before making any investment decisions.


Spectrum

All numbers refer to SPX

The Bear Market of 2022 continues with volatile and dangerous conditions and some extremely rapid moves in both directions with selling into recovery advances and stepping lower becoming the norm.

Daily chart of S&P 500 for 21 June 2022

Save the image to your desktop to view a larger version

The theme of price collapse continues with drops into deeper lows followed by strong recoveries to previous points of 'disappointment'.

June continues with another rapid and destructive decline from the late May recovery into the early June highs – coincidently the site of the March lows and the point of previous strong buying for the recovery into the late March high. Now looking like an important pivot point.

Chart of S&P 500 with T volume oscillator for 20 June 2022

Save the image to your desktop to view a larger version

The T volume oscillator 1 made another series of Buy Signals in the late April – early May timeframe and this led to the strong thrust higher into the late May high. The rapid and ugly decline from the initial projections for a high indicate that the overall structure continues to be extremely bearish and that the market is ultimately looking for a deep low or series of deep lows – a platform – from which to stage the next advance.

We are looking for some real signs of stabilization, a 'v' or 'w' pattern in price and oscillator and given the bearish price action we should look for the market to take out a previous high with strength, preferably with the T volume oscillator moving upwards through the long declining cash build up line 2.

When that occurs we should see a significant lasting move back higher.

We are therefore prepared for a recovery but still mindful of the potential for lower prices from this level.

1 The T volume oscillator is an indication of Buying Power within the market as a whole
2 The cash build-up line is a declining line drawn above a series of lower highs made in the oscillator.

Weekly chart of S&P 500 for20 June 2022

Save the image to your desktop to view a larger version

The weekly chart provides a bigger picture of the current Large structure centered at the March 2020 low and projected the important early January high from the price peak in mid June 2018.

The collapse of this structure is looking increasingly bearish as price looks for a significant support level which of course could still be a lot lower.

We are of course looking at the left-hand side of a large T structure, still in its early development with its center yet to be defined.

Monthly chart of S&P 500 for 20 June 2022

Save the image to your desktop to view a larger version

The monthly chart shows the series of Large structures that were collectively projecting highs for March and April 2022 and were extending the much larger Mega T structure. The collapse from the New Year high was rather ominous and was suggesting that the projections came in a little early, in which case the market is looking for a much more important low or series of lows for the next larger structure.

That could of course still be much lower.

2022 continues with price dropping sharply from the top of a range that has become increasingly expansive since the move above 2500. With price moving below the extremely volatile range from 4100-4600 we can only assume that this expansive price action will continue – in both directions – and that the important 2020 highs around 3385 and 3500 may now become the target. This is a Brave New World and we should trade accordingly.

Regardless of whether the market can move higher or whether significant lows are ahead of us, the simplicity of the proprietary price based S/T Signalling System will continue to keep us on the correct side of the market, currently indicating a Sell Signal since 09 June at 4120.

Although the market is keeping me extremely busy, I intend to launch a Mentoring Service in 2022 that will complement and expand upon the Trading the Line Subscription Service. Topics will include: T Theory, Position Trading, Day Trading, Price action, and Trading Psychology, and the intention is to provide traders with the full educational support that they may need to become successful.

If you would like to learn more about the S/T Signalling System , using T Theory or would be interested in the Mentoring Service , please get in touch.

Be prepared for what is coming next and trade with confidence:

Lombard

All numbers refer to SPX

Bearish, volatile and dangerous conditions continue with some extremely rapid moves in both directions and with selling into recovery advances becoming a hallmark of 2022.

Daily chart of S&P 500 for 10 May 2022

Save the image to your desktop to view a larger version

2022 continues the theme of collapse with drops into deeper lows followed by strong recoveries to previous points of disappointment.

A rapid and destructive decline from the late March high – a token high above the February highs – and itself a point of previous strong buying prior to the January collapse.

Chart of S&P 500 with T volume oscillator for 10 March 2022

Save the image to your desktop to view a larger version

The T volume oscillator 1 made a series of Buy Signals in the early Febraury timeframe and this led to the strong thrust higher in March. We have seen similar oscilaltor Buy Signals in recent days but with strong selling as the market reverses lower. This is of itself unfortunately a warning sign of significant weakness in the market as a whole.

What we can say is that the market is looking for a deep low or series of lows – a platform – from which to stage the next advance.

We are looking for some real signs of stabilization, a 'v' or 'w' pattern in price and oscillator and given the bearish price action we should look for the market to take out a previous high with strength, preferably with the T volume oscillator moving upwards through the long declining cash build up line 2.

When that occurs we should see a significant lasting move back higher.

We are therefore prepared for a recovery but mindful of the potential for lower prices from this level.

1 The T volume oscillator is an indication of Buying Power within the market as a whole
2 The cash build-up line is a declining line drawn above a series of lower highs made in the oscillator.

Weekly chart of S&P 500 for10 May 2022

Save the image to your desktop to view a larger version

The weekly chart provides a bigger picture of the current Large structure centered at the March 2020 low and projected the important early January high from the price peak in mid June 2018.

The collapse of this structure is looking increasingly bearish as price looks for a significant support level which of course could be a lot lower.

We are of course looking at the left-hand side of a large T structure in its early development with its center yet to defined.

Monthly chart of S&P 500 for 10 May 2022

Save the image to your desktop to view a larger version

The monthly chart shows the series of Large structures that were collectively projecting highs for March and April 2022 and were extending the much larger Mega T structure. The collapse from the New Year high was rather ominous and was suggesting that the projections came in a little early, in which case the market is looking for a much more important low or series of lows for the next larger structure.

That could of course be much lower.

2022 continues with price dropping sharply from the top of a range that has become increasingly expansive since the move above 2500. With price moving below the extremely volatile range from 4100-4600 we can only assume that this expansive price action will continue – in both directions. This is a Brave New World and we should trade accordingly.

Regardless of whether the market can move higher or whether significant lows are ahead of us, the simplicity of the proprietary price based S/T Signalling System will continue to keep us on the correct side of the market, currently indicating a Sell Signal since 05 May at 4202.

Although the market is keeping me extremely busy, I intend to launch a Mentoring Service in 2022 that will complement and expand upon the Trading the Line Subscription Service. Topics will include: T Theory, Position Trading, Day Trading, Price action, and Trading Psychology, and the intention is to provide traders with the full educational support that they may need to become successful.

If you would like to learn more about the S/T Signalling System , using T Theory or would be interested in the Mentoring Service , please get in touch.

Be prepared for what is coming next and trade with confidence:

To receive detailed daily analysis, guidance and the updated daily Buy / Sell trigger levels being generated by the Trading the Line system before the market opens, and intraday alerts when appropriate, please become a Member and Sign up for Alerts & Observations – includes access to Members Area and the 'Explanatory Notes' for all of the concepts discussed as well as the new 'Notes on Daytrading' which provides insight into how to look for shorter term entries and exits within the context of the S/T Signalling System.


Norfolk

All numbers refer to SPX

Volatile and dangerous conditions continue with some extremely rapid moves in both directions.

Daily chart of S&P 500 for 07 March 2022

Save the image to your desktop to view a larger version

2022 collapses into a large T structure centered at the late January lows with projections into the early February double tops but this structure itself collapses becoming increasingly bearish with the reaction to economic and geopolitical uncertainty.

A small T forms at the deep 24 February low with a short projection for a high into 02 March and with perhaps further potential, itself starts to collapse with a Cover and Sell Signal on Friday 04 March but closing back above the Sell Signal line at end of day cancelling the Sell signal for now.

Chart of S&P 500 with T volume oscillator for 07 March 2022

Save the image to your desktop to view a larger version

The T volume oscillator 1 made strong Buy Signals after the important price lows on 31 January and 25 February, with the oscillator moving up through the declining cash build up lines2 and confirming the prescence of active T Structures. The structures have, however, turned bearish with subsequent price collapses, indicating (for now) that the current structure is still larger and deeper.

T Theory projects highs from the important price highs and the important oscillator highs with the amount of time spent declining from highs into important lows equal to that of the subsequent price rise.

Of course, the 24 February low may still be an important low and we may be seeing the beginnings of a new large structure under construction.

We are therefore prepared for a recovery but mindful of the potential for lower prices from this level.

1 The T volume oscillator is an indication of Buying Power within the market as a whole
2 The cash build-up line is a declining line drawn above a series of lower highs made in the oscillator.

Weekly chart of S&P 500 for07 March 2022

Save the image to your desktop to view a larger version

The weekly chart provides a bigger picture of the current Large structure centered at the March 2020 low and projected the important early January high from the price peak in mid June 2018.

The logic of the structure would suggest further highs projected from the earlier important highs in 2018 to complete the structure – but probably lower highs – in early April and mid-late May of this year. We should expect  quite a bumpy ride in due course.

The bottom of the recent price rise (since June 2021) and the rising trend line would be important levels to hold if this structure is to stay intact.

Monthly chart of S&P 500 for 07 March 2022

Save the image to your desktop to view a larger version

The monthly chart shows the series of Large structures that were collectively projecting highs for March and perhaps April 2022. The collapse from the New Year high is rather ominous and is suggesting that the projections came in a little early, in which case the market may now be looking for a more important low for the next larger structure.

2022 continues with price dropping sharply from the top of a range that has become increasingly expansive since the move above 2500. With price moving within the extremely volatile range from 4100-4600 we can only assume that this expansive price action will continue – in both directions. This is a Brave New World and we should trade accordingly.

Regardless of whether the market can move higher or whether significant lows are ahead of us, the simplicity of the proprietary price based S/T Signalling System will continue to keep us on the correct side of the market.

In 2022, I intend to launch a Mentoring Service that will complement and expand upon the Trading the Line Subscription Service. Topics will include: T Theory, Position Trading, Day Trading, Price action, and Trading Psychology, and the intention is to provide traders with the full educational support that they may need to become successful.

If you would like to learn more about the S/T Signalling System , using T Theory or would be interested in the Mentoring Service , please get in touch.

Be prepared for what is coming next and trade with confidence:

To receive detailed daily analysis, guidance and the updated daily Buy / Sell trigger levels being generated by the Trading the Line system before the market opens, and intra-day alerts when appropriate, please become a Member and Sign up for Alerts & Observations – includes access to Members Area, Explanatory Notes (pdf) for all of the concepts discussed, and Notes on Day Trading (pdf)

Disclaimer: This is the diary of a personal trading system, its methodology and the signals that it is producing. You are welcome to follow along but please understand that the information presented here is for educational purposes only. No recommendations are being made to buy, or sell stocks, options or futures contracts. Please consult your own financial advisor before making any investment decisions.


Rubicon

All numbers refer to SPX

An extreme move up into the End of Year, followed by some very heavy selling.

Welcome to 2022.

Daily chart of S&P 500 for 10 January 2022

Save the image to your desktop to view a larger version

A large DB (Double Bottom) Structure projected into 30 December and 04 January (and with potential into 13 January) collapses from the new all time high on 04 January and is heavily sold into in response to FED minutes on 05 January as traders rush for the exits.

Chart of S&P 500 with T volume oscillator for 10 January 2022

Save the image to your desktop to view a larger version

The T volume oscillator 1 made strong Buy Signals after the important price lows on 03 December and 20 December, with the oscillator moving up through the declining cash build up lines2 and confirming the prescence of active T Structures.

T Theory projects highs from the important price highs and the important oscillator highs with the amount of time spent declining from highs equal to that of the subsequent price rise.

Curiously, although the price has collapsed from the highs, the T volume oscillator is still positive. Either we have not seen the important low(s) yet and there is significantly lower prices ahead or the buying power remains relatively strong and recovery is imminent.

We are therefore prepared for a recovery but mindful of the potential for lower prices from this level.

1 The T volume oscillator is an indication of Buying Power within the market as a whole
2 The cash build-up line is a declining line drawn above a series of lower highs made in the oscillator.

Weekly chart of S&P 500 for10 January 2022

Save the image to your desktop to view a larger version

The weekly chart provides a bigger picture of the current Large structure centered at the March 2020 low and projecting the current high from the price peak in mid June 2018 and this would explain the current decline.

The logic of the structure would suggest further highs in early April and mid-late May of this year but with quite a bumpy ride in due course.

The bottom of the recent price rise and the rising trend line would be important levels to hold if this structure is to stay intact.

Monthly chart of S&P 500 for 10 January 2022

Save the image to your desktop to view a larger version

The monthly chart shows the series of Large structures that are are still collectively projecting highs for March and/or April 2022.

2022 starts with price dropping back from the top of a range that has become increasingly expansive since the move above 2500. With price moving back into the previously extremely volatile range above 4500 we can only assume that this expansive price action will continue – in both directions. This is a Brave New World and we should trade accordingly.

With much discussion going on regarding what the FED is and has been doing, I would like to recommend John Titus' fascinating in depth presentation on his youtube channel BestEvidence: Larry & Carstens' Excellent Pandemic.

Regardless of whether the market can move higher or whether significant lows are ahead of us, the simplicity of the proprietary price based S/T Signalling System will continue to keep us on the correct side of the market, with price currently below the Sell Signal line at 4702 since 06 January 2022.

In 2022, I intend to launch a Mentoring Service that will complement and expand upon the Trading the Line Subscription Service. Topics will include: T Theory, Position Trading, Day Trading, Price action, and Trading Psychology, and the intention is to provide traders with the full educational support that they may need to become successful.

If you would like to learn more about the S/T Signalling System, using T Theory or would be interested in the Mentoring Service, please get in touch.

To receive detailed daily analysis, guidance and the updated daily Buy / Sell trigger levels being generated by the Trading the Line system before the market opens, and intra-day alerts when appropriate, please become a Member and Sign up for Alerts & Observations – includes access to Members Area, Explanatory Notes (pdf) for all of the concepts discussed, and Notes on Day Trading (pdf)

Disclaimer: This is the diary of a personal trading system, its methodology and the signals that it is producing. You are welcome to follow along but please understand that the information presented here is for educational purposes only. No recommendations are being made to buy, or sell stocks, options or futures contracts. Please consult your own financial advisor before making any investment decisions.


Lucia

All numbers refer to SPX

Some very strong buying since making lows around 4500 on 01 and 03 December quickly taking the market back to the all time highs.

A new Buy Signal at 4581 on 06 December and a new active T structure.

Should we expect further highs?

Daily chart of S&P 500 for 13 December 2021

Save the image to your desktop to view a larger version

Very strong and intimidating price action intermixed with some sharp selling as the market muscles its way higher.

Chart of S&P 500 with T volume oscillator for 13 December 2021

Save the image to your desktop to view a larger version

The T volume oscillator 1 started to deteriorate after 09 November and especially after 17 November, in-line with previous projections for a high giving some warning of the subsequent selling. Having made a low with the heavy selling on 01 December, the oscillator then made a Buy Signal on 06 and 07 December with a strong move up through the declining cash build up line2 of the oscillator indicating the potential for a large T structure emerging

The oscillator projects strength from the previous oscillator highs into the next series of highs via the oscillator lows, and the price highs also project strength from the previous price highs into the next series of price highs via the price lows. The T structures project the current highs with potential into the Christmas holiday and possibly beyong into New Year.

1 The T volume oscillator is an indication of Buying Power within the market as a whole
2 The cash build-up line is a declining line drawn above a series of lower highs made in the oscillator.

Weekly chart of S&P 500 for13 December 2021

Save the image to your desktop to view a larger version

The weekly chart shows a strong recovery from the weekly 21 ema back to the high forming a new small T which projects strength into the week ending 24 December – also in-line with the small T at the previous low.

If the large T structure is still larger, we can project the next major highs for the week ending 07 January, with the possibility of longer projections into early April and mid-late May 2022.

The rising line under the recent lows is an important support line, and a significant break of that area would be a serious warning.

Monthly chart of S&P 500 for 13 December 2021

Save the image to your desktop to view a larger version

The monthly chart continues to show strength with a strong recovery from last months spike high. The previous high was in-line with the projection for a high from the large T Structure centered at the March 2020 low, which continues to project highs into March and May of 2022.

2021 continues with a range that has become increasingly expansive since the move above 2500. With price above 4500 we can only assume that this will continue. This is a Brave New World and we should trade accordingly.

Regardless of whether the market can continue higher or whether significant lows are ahead of us, the simplicity of the proprietary price based S/T Signalling System will continue to keep us on the correct side of the market, with price currently back on a Buy Signal since moving above 4581 on 06 December 2021.

If you would like to learn more about using the S/T Signalling System please get in touch.

Be prepared for what is coming next and trade with confidence:

To receive detailed daily analysis, guidance and the updated daily Buy / Sell trigger levels being generated by the Trading the Line system before the market opens, and intraday alerts when appropriate, please become a Member and Sign up for Alerts & Observations – includes access to Members Area and the 'Explanatory Notes' for all of the concepts discussed as well as the new 'Notes on Daytrading' which provides insight into how to look for shorter term entries and exits within the context of the S/T Signalling System.

Disclaimer: This is the diary of a personal trading system, its methodology and the signals that it is producing. You are welcome to follow along but please understand that the information presented here is for educational purposes only. No recommendations are being made to buy, or sell stocks, options or futures contracts. Please consult your own financial advisor before making any investment decisions.