Ouch

Looks like the crash so many have been calling for just happened.
And it looks like the current target may be 1940ish.
No reason to get too bullish until we clear back over the 200MA but it should be noted that excellent buying does occur at the lower edge of the channel marked in fine green, this approximates to Terry Laundry's energy channel.

Chart of S&P500 for 24 August 2015


Below the 200

The first significant move below the 200MA for some time indicating some additional dangers in the market.
Much needed but does warn of possible entry into a bear market. The megaphone formation very much in place suggesting the potential for further selling.

Chart of S&P500 for 21 August 2015

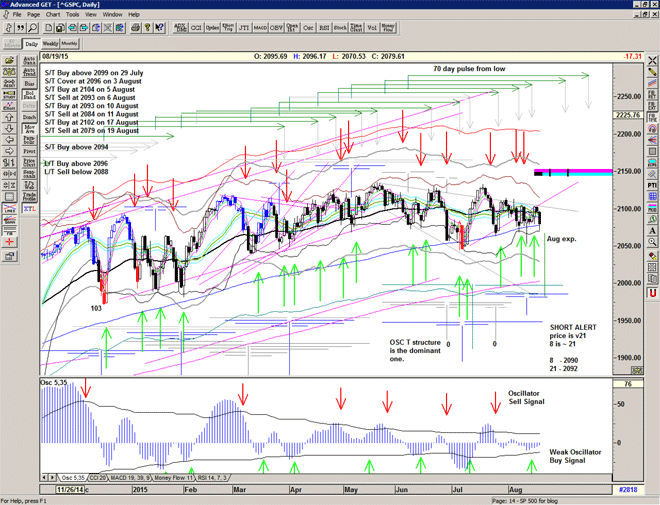
S/T Buy at 2102

A close above the mid channel and above 2094 triggers a short term Buy Signal.
Looks like everytime we see near to the 200 MA si a Buy signal.

If we hold and move higher, we can expect another peak around the beginning of September, perhaps another attempt at the all time high.

Chart of S&P500 for 18 August 2015

Close to a sell signal

The market flirts with a sell signal below 2093 but not decicisively.
Probably needs to test the rising pink line before challenging the high again.
Summer doldrums, maybe best to take a holiday.

Futures looks like a Buy Signal is being generated.

Chart of S&P500 for 5 August 2015