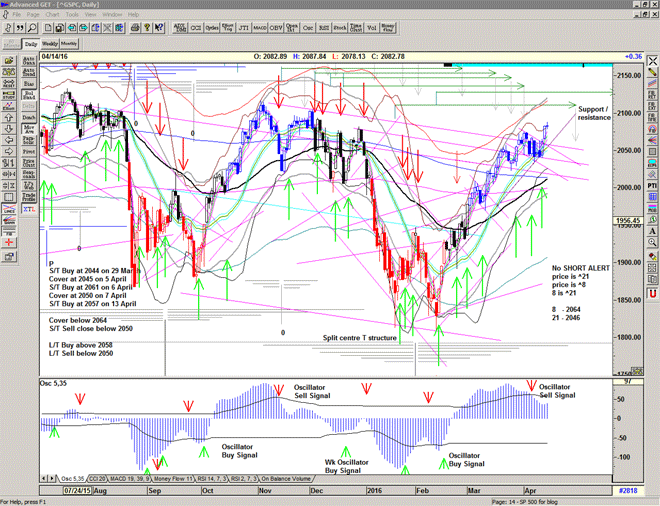
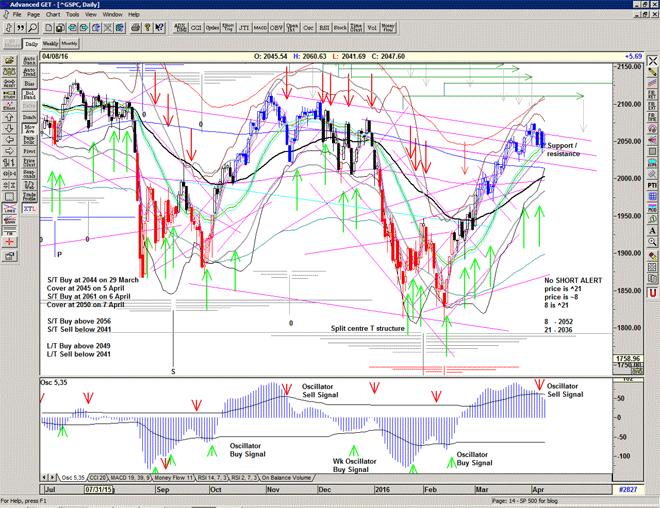
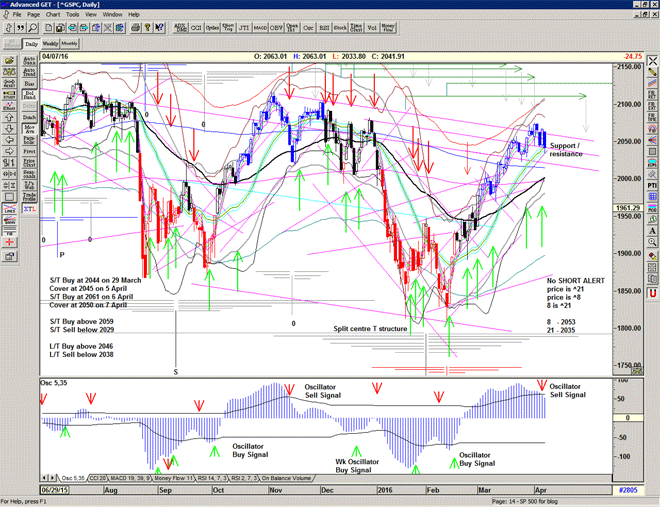
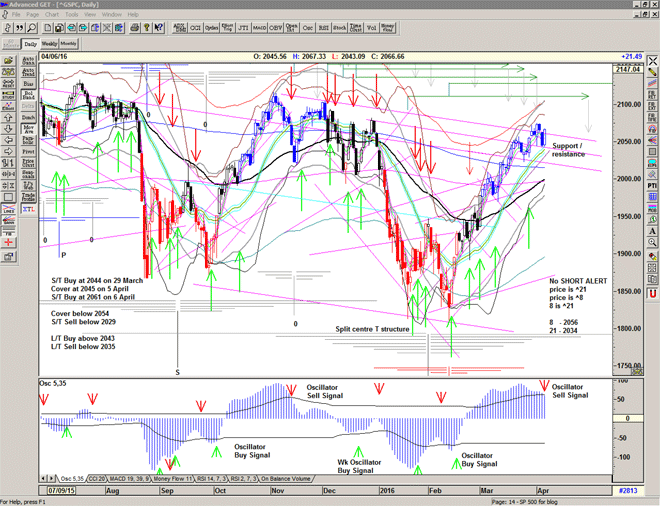
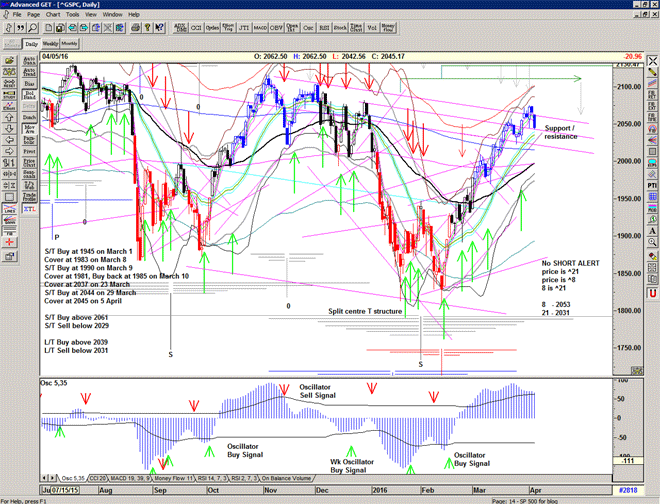
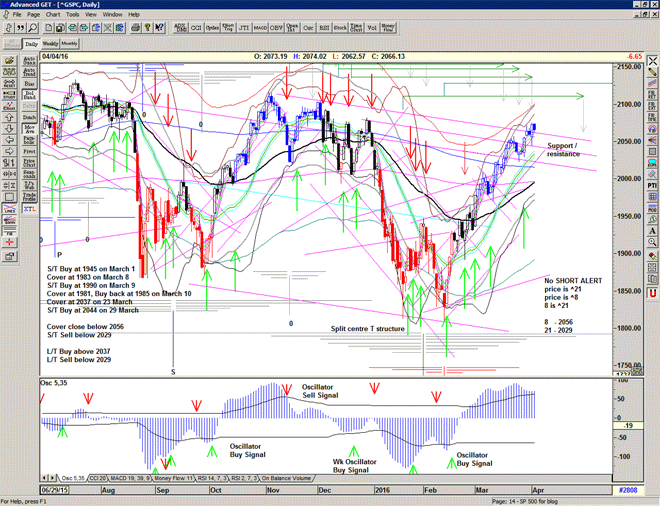
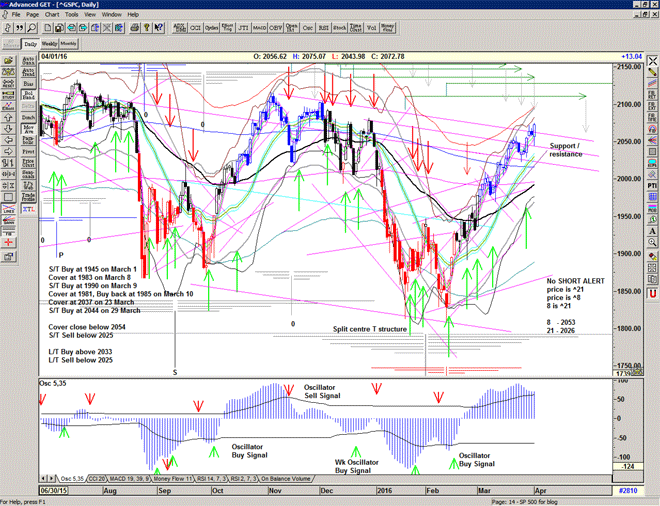
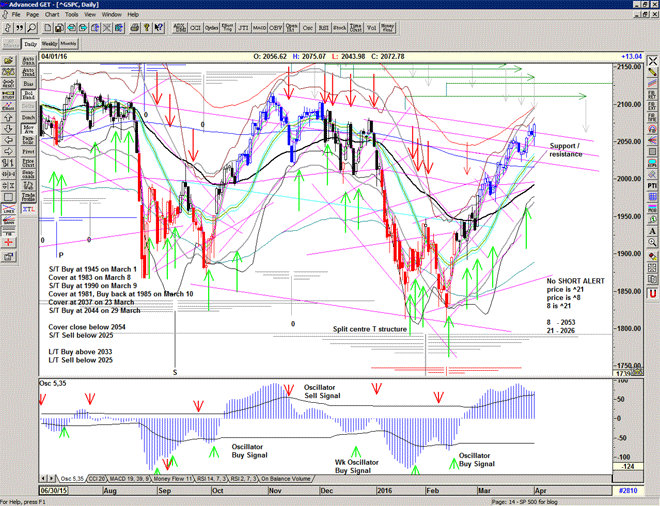
Continuation Buy Signal after early morning weakness. T volume oscillator turns positive and points to potential new T structure highs late April / early May.Watch action at the bollingers, squeeze ocurring.
Squeeze occurring, probably going to see 2080 and 2020 followed by a bigger squeeze one way or the other. Skew at a very low level so probably up first.
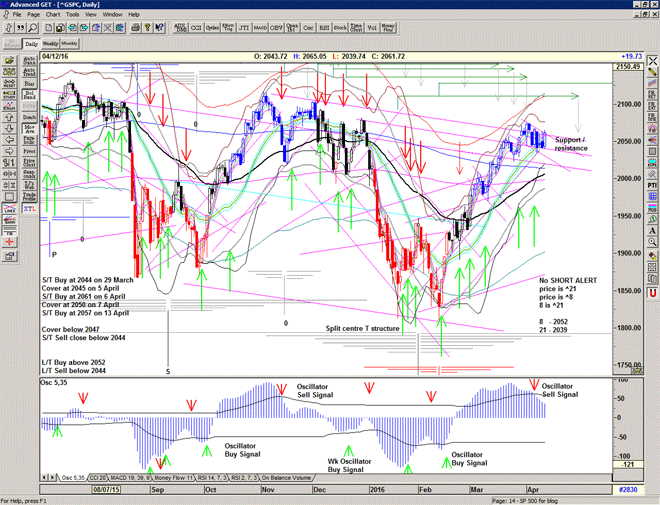
Market recovering on soothing words, and oil pumping. OSC drops below the break out bands, signalling further weakness ahead. Notice how the last time this occurred the market recovered but did not make significant new highs and ultimately led to a major low.
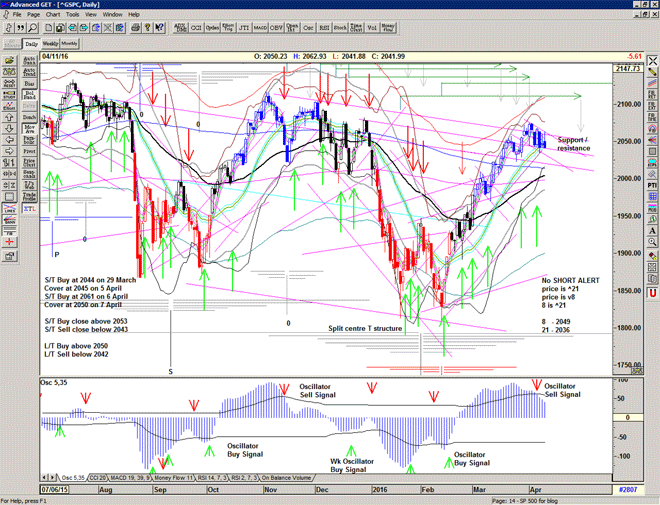
T volume oscillator turns negative. A speculative short position could be considered, if further weakness today. Could be, 70 day pulse from low, and 64 days peak to peak.
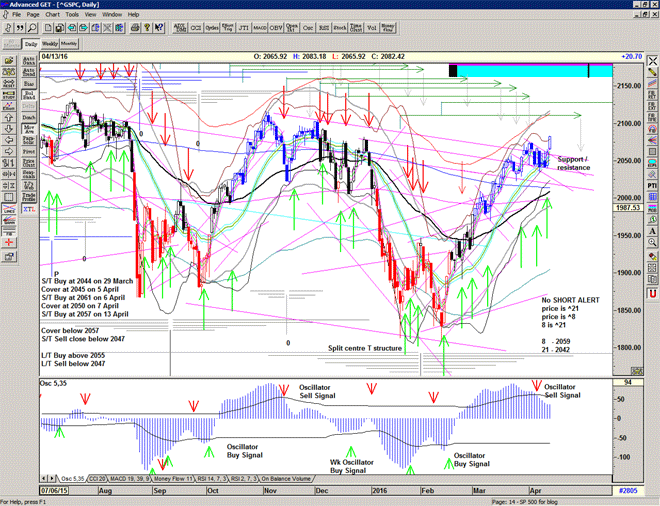
An important diagonal resistance pushed through, making new all time highs seem likely and adding to the T structure, projecting highs in August possible. Longer term charts looking much more positive.