Isolation

In fear every day, every evening,
He calls her aloud from above,
Carefully watched for a reason,
Painstaking devotion and love,
Surrendered to self preservation,
From others who care for themselves.
A blindness that touches perfection,
But hurts just like anything else.

Joy Division, Isolation, 1980

Emergency measures and more panic, selling late Sunday from the get go in response to a second rate cut.
A strong short-covering bounce is sold into heavily back into the morning low.

A recurring theme. Shorts take profits at or near lock down limits to prevent being trapped, bargain hunters buy the dip up into a previous low and then everyone sells.

Chart of S&P 500 for 17 March 2020

To receive detailed daily analysis, guidance and the updated daily Buy / Sell trigger levels being generated by the Trading the Line system before the market opens, and intra-day alerts when appropriate, please become a Member and Sign up for Alerts & Observations – includes access to Members Area, Explanatory Notes (pdf) for all of the concepts discussed, and Notes on Day Trading (pdf)

Disclaimer: This is the diary of a personal trading system, its methodology and the signals that it is producing. You are welcome to follow along but please understand that the information presented here is for educational purposes only. No recommendations are being made to buy, or sell stocks, options or futures contracts. Please consult your own financial advisor before making any investment decisions.


Sell Signal active below 2718

No follow through to Friday's surge and a new Sell Signal active below 2718.

Another huge overnight drop and a trading halt at 2490.

A plunge to 2400 is met with strong buying back to 2562 before the selling resumed back towards the low

Expect many more 50-100 moves in either direction as volatility drives direction.

State

A state of emergency and a bounce from 2500 with a short-covering surge into the close.

A respite from the heavy selling and maybe signalling potential for some kind of relief move.

However, Futures are again down considerably overnight and locked at -5% with other markets indicating -7-8%

Sell Signal active when markets re-open

Chart of S&P 500 for 16 March 2020

To receive detailed daily analysis, guidance and the updated daily Buy / Sell trigger levels being generated by the Trading the Line system before the market opens, and intra-day alerts when appropriate, please become a Member and Sign up for Alerts & Observations – includes access to Members Area, Explanatory Notes (pdf) for all of the concepts discussed, and Notes on Day Trading (pdf)

Disclaimer: This is the diary of a personal trading system, its methodology and the signals that it is producing. You are welcome to follow along but please understand that the information presented here is for educational purposes only. No recommendations are being made to buy, or sell stocks, options or futures contracts. Please consult your own financial advisor before making any investment decisions.


In a State

From bad to ugly. An extraordinary week with volatility off the charts.

Panic selling and panic buying.

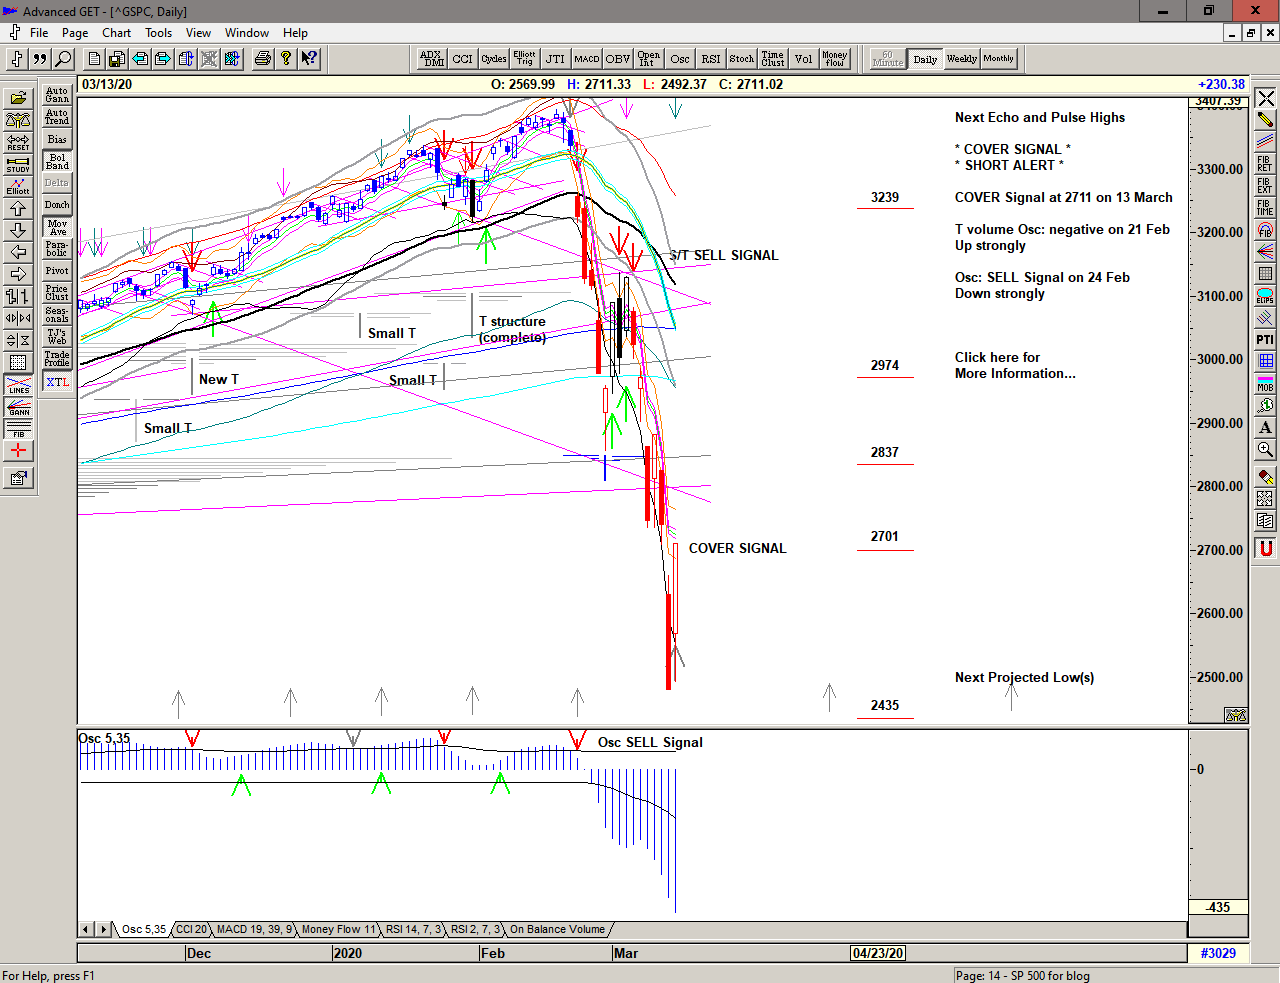
A visit to 2400 in overnight action Thursday and a state of emergency announcement.

A closing short covering move into the last minutes of the week providing some relief to the mayhem and close enough to the Cover Signal level on the recent Sell Signal to suggest at least some kind of recovery may be ahead.

So, what's next?

Daily chart of S&P 500 for 16 March 2020

Save the image to your desktop to view a larger version

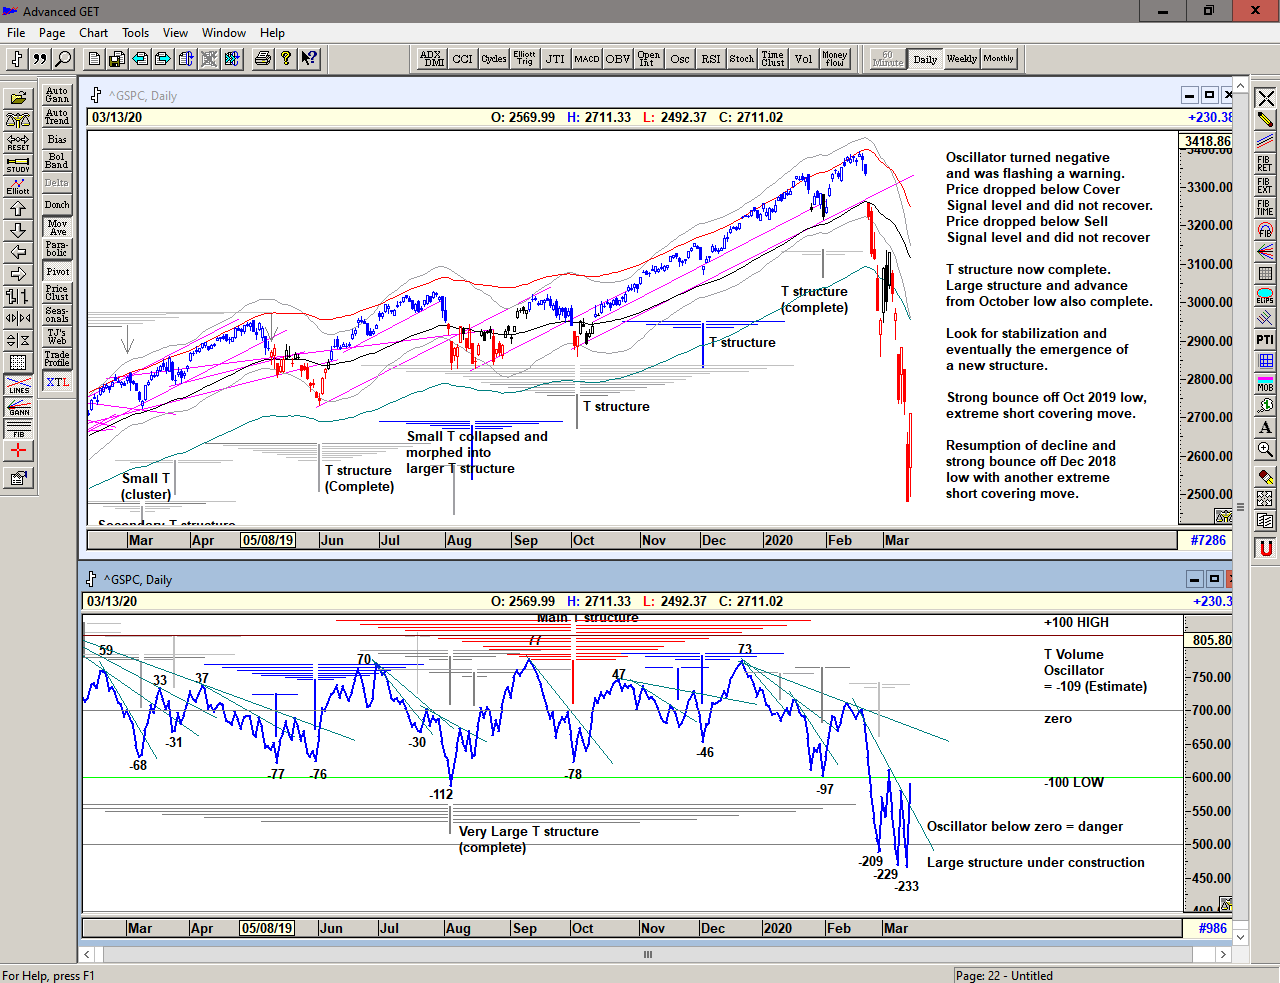
As we can see in the chart below with the T volume oscillator*, the rapid drop coincided with the completion of the very large T structure which originates at the high in the oscillator on 18 January 2019 – after the buying surge from the December 2018 panic low – and centered on the previous major oscillator low on 08 May 2019.

With the extreme selling we can see the 3 major moves down forming deep lows in the oscillator in the -200 area. The end of week surge places the T volume oscillator up above the level of the previous high on 10 March and potentially above the short cash build up line ** – suggesting buying power for a recovery move of some kind.


Of course a higher low in the oscillator would be preferable, especially if accompanied with a lower price.

** The T volume oscillator is an indication of Buying Power within the market as a whole
** The cash build-up line is a declining line drawn above a series of lower highs made in the oscillator.

Chart of S&P 500 for 16 March 2020

Save the image to your desktop to view a larger version

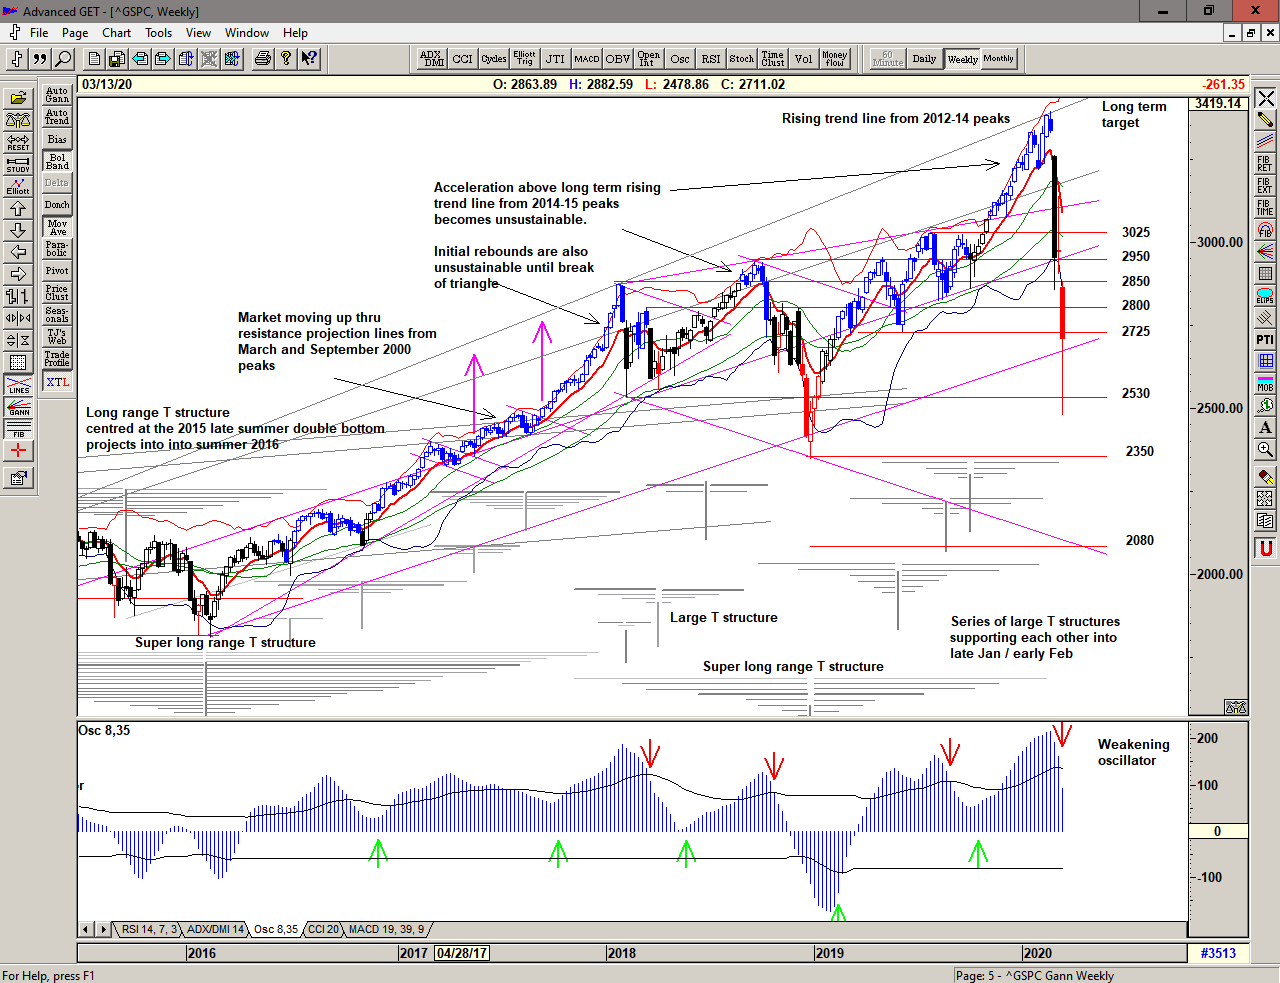
Zooming out to the weekly chart, we can see that the late recovery to 2700 places the market back above the trendline from the 2016 low and action above 2600 is consistent with a potential recovery, and some kind of bounce for a week or two would be consistent with the previous collapses from the all time highs.

However, a weekly close below the channel would suggest a more protracted decline and potentially target the December low at 2350 or even lower.

Is the market starting to map out a very large megaphone formation – with a series of expanding highs to lows? If so this maybe looks for support in the 2000 area and the potential for re-testing some of the highs and lows during the 2015-16 period.

Weekly Chart of S&P 500 for 16 March 2020

Save the image to your desktop to view a larger version

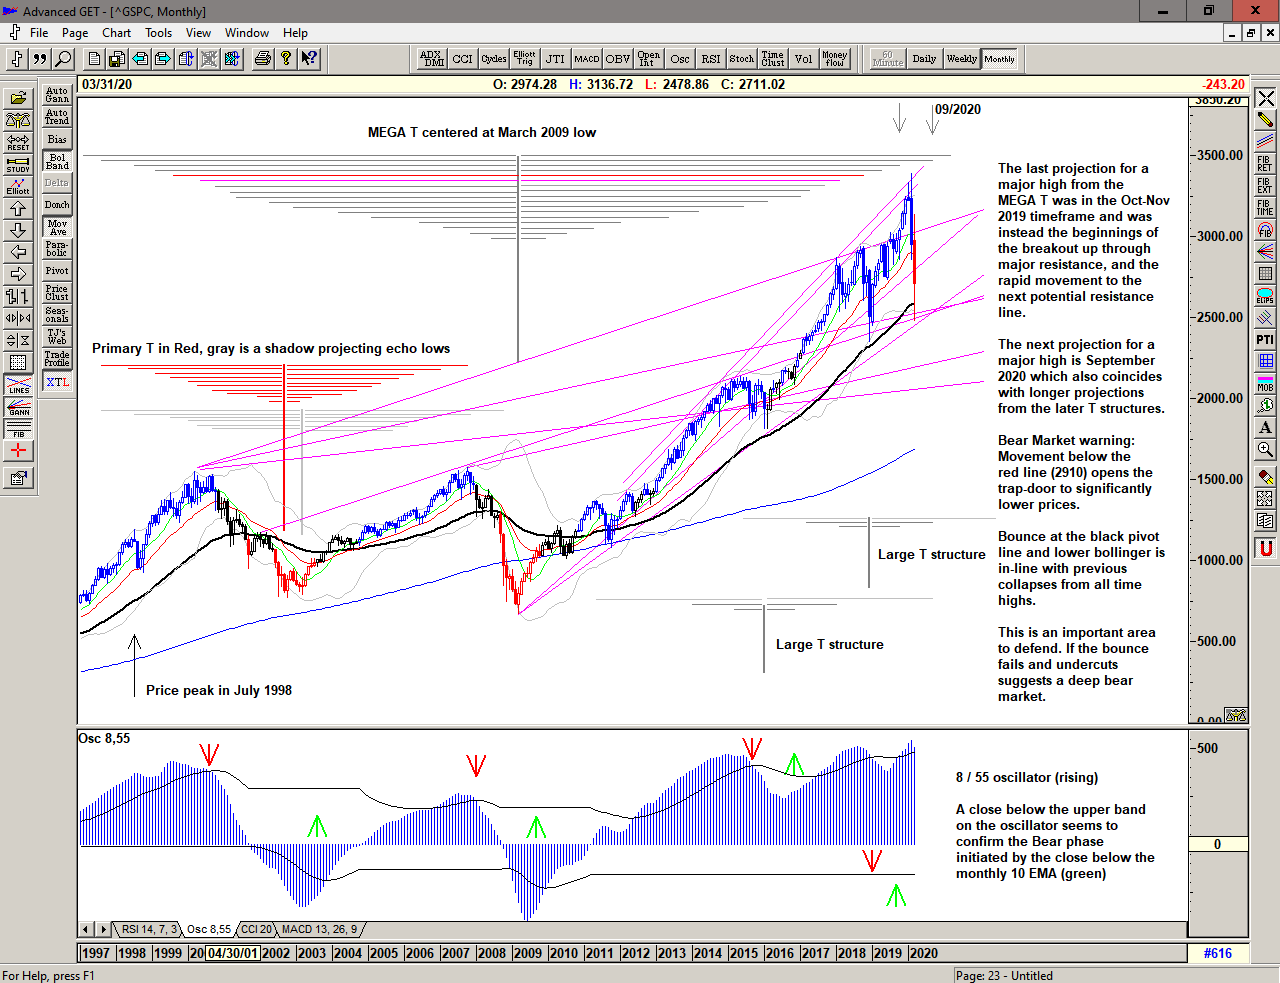
The monthly chart shows how the market has currently bounced at the strong support of the black line, lower bollinger band and at the rising trend lines from the 2009 low and from the 2000 high, showing how fundamentally important the 2500 level is.

Key levels above are the red line at 2886 and the green line at 3012.

Penetration of the red line is a Bear Market signal. A Bull market finds support at the green line.

In the previous severe bear markets we can see that price bounced at the black line and recovered to the red and green lines but turned back down again. Alternatively, in 2016 we can see that the black line held and the market eventually resolved higher.

The long term oscillator is now weakening towards a long term Sell Signal.

If the market is entering a severe Bear Market we can see that there is significant downside once 2500 gives way.

Monthly chart of S&P 500 for 16 March 2020

Save the image to your desktop to view a larger version

2020 is bringing some fast and furious action in the market with a range that became increasingly expansive since the move above 2500 in 2017. We can only assume that this will continue. This is a Brave New World.

Regardless of whether the market can recover or whether further significant lows are ahead of us, the simplicity of the proprietary price based S/T Signalling System will continue to keep us on the correct side of the market, with price currently back near a Cover Signal level above 2700 on 13 March 2020.

To receive detailed daily analysis, guidance and the updated daily Buy / Sell trigger levels being generated by the Trading the Line system before the market opens, and intra-day alerts when appropriate, please become a Member and Sign up for Alerts & Observations – includes access to Members Area, Explanatory Notes (pdf) for all of the concepts discussed, and Notes on Day Trading (pdf)

Disclaimer: This is the diary of a personal trading system, its methodology and the signals that it is producing. You are welcome to follow along but please understand that the information presented here is for educational purposes only. No recommendations are being made to buy, or sell stocks, options or futures contracts. Please consult your own financial advisor before making any investment decisions.


Market closing at 2710

Strong selling into the gap up above 2600. A second look before declining back to re-test 2500.

A strong a recovery into the afternoon with an intervention inspired surge into the close.

Just below the SELL Signal level – but given that move I would suggest that the current Sell Signal is most likely complete.

Cyclone

Panic.

Another gap down from limit locked to limit locked finds the market defending 2500.

A brief visit to 2660 is sold heavily and the market gives up 2500 into the close.

Now near the December 2018 lows.

In the eye of the storm.

Chart of S&p 500 for 13 March 2020

To receive detailed daily analysis, guidance and the updated daily Buy / Sell trigger levels being generated by the Trading the Line system before the market opens, and intra-day alerts when appropriate, please become a Member and Sign up for Alerts & Observations – includes access to Members Area, Explanatory Notes (pdf) for all of the concepts discussed, and Notes on Day Trading (pdf)

Disclaimer: This is the diary of a personal trading system, its methodology and the signals that it is producing. You are welcome to follow along but please understand that the information presented here is for educational purposes only. No recommendations are being made to buy, or sell stocks, options or futures contracts. Please consult your own financial advisor before making any investment decisions.


Pandora’s box

Another heavy down day with the market initially trying to hold onto 2800 and ultimately looking for some kind of support near 2700.

Market locked limit down in overnight session

5% overnight decline – 2602 – no trading below until cash session

7% decline – 2549 – 15 minute halt if occurs before 3.25 pm
13% decline – 2385 – 15 minute halt if occurs before 3.25 pm
20% decline – 2193 – trading will halt for remainder of the day

Chart of S&P 500 for 11 March 2020

To receive detailed daily analysis, guidance and the updated daily Buy / Sell trigger levels being generated by the Trading the Line system before the market opens, and intra-day alerts when appropriate, please become a Member and Sign up for Alerts & Observations – includes access to Members Area, Explanatory Notes (pdf) for all of the concepts discussed, and Notes on Day Trading (pdf)

Disclaimer: This is the diary of a personal trading system, its methodology and the signals that it is producing. You are welcome to follow along but please understand that the information presented here is for educational purposes only. No recommendations are being made to buy, or sell stocks, options or futures contracts. Please consult your own financial advisor before making any investment decisions.

Seed

Heavy selling into a gap up with another look down at 2730 is eventually bought strongly with hints of intervention as price attempts to stabilize and hold onto the recent low.

Extremely dangerous conditions continue.

With prices near the Pandora's Box level of 2800 there is of course the potential for some kind of continuing crash or alternatively some kind of intervention by central banking to prevent a crash.

Chart of S&P 500 for 11 March 2020

To receive detailed daily analysis, guidance and the updated daily Buy / Sell trigger levels being generated by the Trading the Line system before the market opens, and intra-day alerts when appropriate, please become a Member and Sign up for Alerts & Observations – includes access to Members Area, Explanatory Notes (pdf) for all of the concepts discussed, and Notes on Day Trading (pdf)

Disclaimer: This is the diary of a personal trading system, its methodology and the signals that it is producing. You are welcome to follow along but please understand that the information presented here is for educational purposes only. No recommendations are being made to buy, or sell stocks, options or futures contracts. Please consult your own financial advisor before making any investment decisions.


Carthage

A 7% drop into a trading halt, a strong short covering bounce and more persistent selling as things get ugly.

Extremely dangerous conditions.

Chart of S&P 500 for 10 March 2020

To receive detailed daily analysis, guidance and the updated daily Buy / Sell trigger levels being generated by the Trading the Line system before the market opens, and intra-day alerts when appropriate, please become a Member and Sign up for Alerts & Observations – includes access to Members Area, Explanatory Notes (pdf) for all of the concepts discussed, and Notes on Day Trading (pdf)

Disclaimer: This is the diary of a personal trading system, its methodology and the signals that it is producing. You are welcome to follow along but please understand that the information presented here is for educational purposes only. No recommendations are being made to buy, or sell stocks, options or futures contracts. Please consult your own financial advisor before making any investment decisions.

Skalder

On Friday, another big drop is met with strong buying into a morning high and persistent selling into an afternoon low at 2900 before a strong recovery into the close.

Sell Signal still active as the market attempts to place a double bottom.

A bipolar and dangerous market.

Futures overnight have dropped rapidly 5% triggering a limit down trading halt on the overnight session at 2817.

Chart of S&P 500 for 09 March 2020

To receive detailed daily analysis, guidance and the updated daily Buy / Sell trigger levels being generated by the Trading the Line system before the market opens, and intra-day alerts when appropriate, please become a Member and Sign up for Alerts & Observations – includes access to Members Area, Explanatory Notes (pdf) for all of the concepts discussed, and Notes on Day Trading (pdf)

Disclaimer: This is the diary of a personal trading system, its methodology and the signals that it is producing. You are welcome to follow along but please understand that the information presented here is for educational purposes only. No recommendations are being made to buy, or sell stocks, options or futures contracts. Please consult your own financial advisor before making any investment decisions.