
Since the 01 March high in the S&Ps, we have seen a series of lower highs, and lower lows with strong bounces that have been sold into – marking out a defined downward channel.
So far the selling has been relatively mild, in comparison to previous corrective periods, but more and more it seems that the market is at an inflection point, and the obvious question is: is about to get unpleasant?
Lets have a look at the bigger picture:
The market has been trying to hold onto some strong rising support lines, whilst at the same time acknowledging a descending resistance line and this produces a triangulation. Triangulations are squeezes – direction uncertain.
We could make comparisons with the September 16 period, or alternatively with the May 16 period. It seems quite usual for the market to test a descending resistance line 3 or 4 times before making a firm decision whether to break it or rollover.
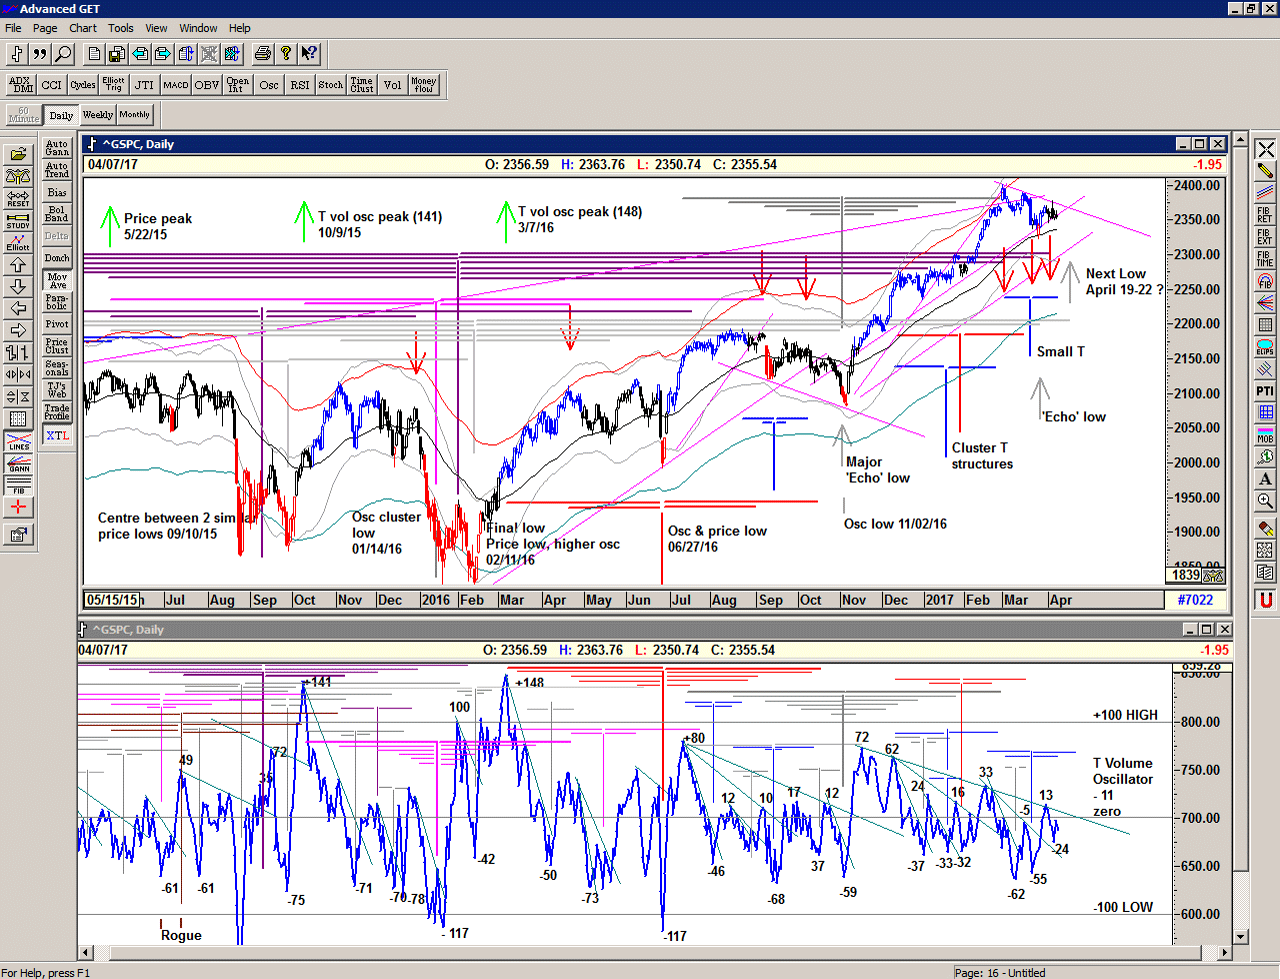
The very large T structure which still seems to be dominant – from the January-February 2016 double bottom projected a series of price highs from right back to the November and December 2014 highs to the recent highs. Before the November 2014 highs, the previous low was at a comparative level to the 2016 lows and so this T structure should be complete now. This could well explain the current lack of buying power in the market and could certainly produce some lower lows in the near future, as the market looks to re-charge itself.
The same T structure also projects an Echo low in the April 19-22 period, which remains to be seen.
We can also see that the buying surge at the Election low has produced a long line of shallow lower highs in the oscillator which we can describe as a cash-build up line, marked in green. When we get a buying surge that cuts through this line, we can draw the next large T structure. Of course, we may need to go down first in order to get the bounce required to break up through this cash build up.
We watch the oscillator for clues, but we use price as the leading indicator.
Be prepared for what is coming next.
For more detailed ongoing analysis of the developments in the S&P500 index on a daily basis, please Sign up for daily Alerts & Observations – includes access to Members Area and Explanatory Notes.