
Time for an update on the general outlook for the S&P 500.
In my last report on 19 September the market was approaching an important test of strength. It had just traded above 2500 for the first time and was approaching an initial projection of the new T structure for a short term peak on 21 September. With the market showing significant strength it was a good time to ask the questions: Is there more? or will the round number target present a problem moving forward? I made the point that what happened after that projected peak would be very telling indeed, because the market was showing support for a much larger T structure and consequently significantly higher prices.
The answer came quickly, a few days of weakness which did not trigger a 'cover signal' and on 25 September a brief spike down to 2488 was all that was required to trigger a continuation Buy Signal that was itself confirmed by a movement above the slight declining resistance from that previous high, and the result was a rapid advance straight to 2550. This move without a doubt had many players incorrectly positioned for a decline below 2500 into an October low.
And so, what's next? Are we there yet?
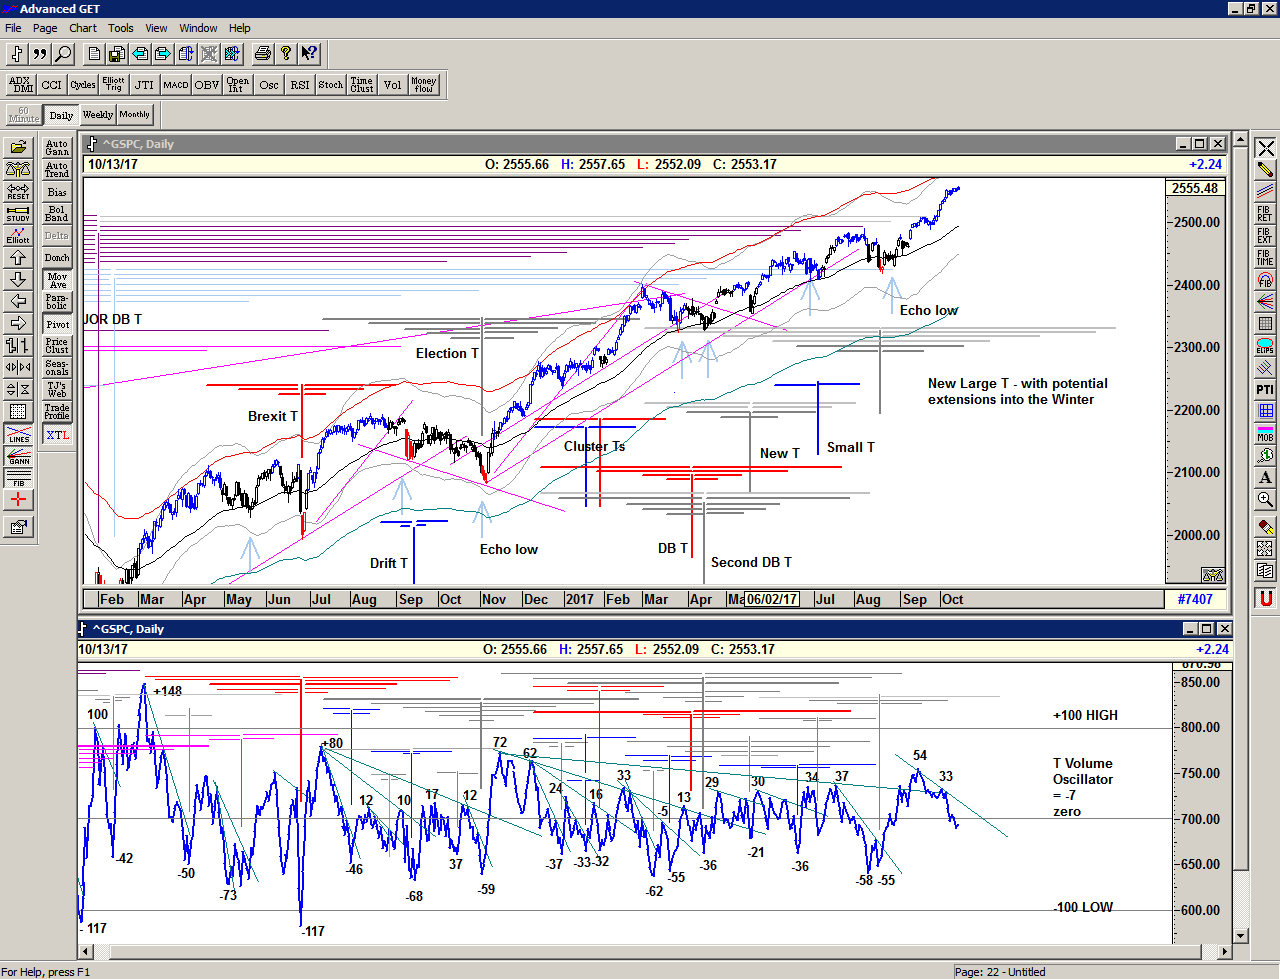
The market breezed through the first layer of potential resistance on a rising line from the 15 March peak but stalled at the parrallel rising line from the 1 March peak, and there it has remained for the past week, drifting slightly higher.
Firstly, this T structure is now already larger than its initial peak to low and so it is now drawing strength from the June declines, and this allows for several projections of peaks in the coming weeks, as well as the possibility of further projections higher afterwards.
The market has rapidly moved higher with significant strength and has signalled that the current T structure is large – potentially drawing strength from each of the declines earlier this year. This is because the oscillator has moved upwards through the very long cash build up line going right back to the previous oscillator high at 72 on 15 november 2016. If you want an explanation for a melt up in stocks this is it.
Secondly, the T volume oscillator has just dropped below the zero line. This in itself is not a sell signal but indicates a weakening of breadth and therefore a level of profit-taking is going on in the backgound. Not particularly surprising but well worth keeping an eye upon as this is also a characteristic of a distribution period prior to a possible decline – not necessarily a severe one. Because of this I am expecting to see a sideways market develop with probes to the downside as well as to the upside whilst the market establishes an upper range prior to the next move. Up or down.
If we do get a decline at one of the next projected peaks, then we watch the oscillator for bullish divergence and for a movement upwards through the short cash build up line of declining lows in the oscillator – the signature of the next small T structure.
If we do not get a decline but rather a continued sideways movement (such as July/August 2016 or December 2016-January 2017), then we continue to monitor price and oscillator carefully for signs that the exit will be either upwards or downwards.
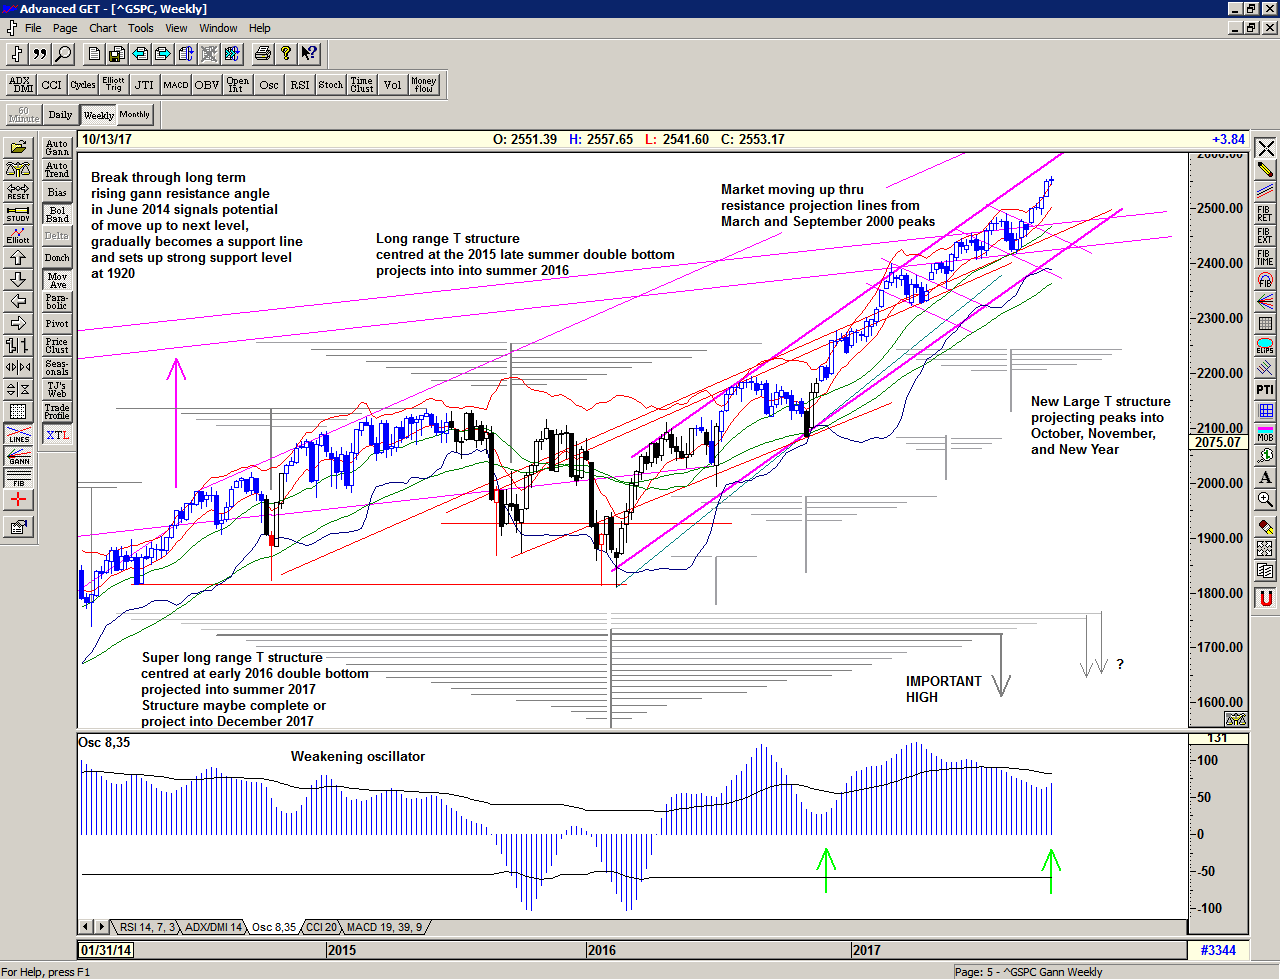
Zooming out to the weekly chart, we can see that the market is rising well within a strongly defined channel and is perhaps playing catch up on some of the lost time in late 2015 and early 2016 after the market lost its rising trajectory in May 2015. That rising trajectory just might be the current target and if it was acheived we could be looking at 2700 by year end. That may of course be a little too much to ask for but if the current T structure was to peak out at the upper edge of the pink channel that would be in the region of 2660. Just food for thought.
The super long range T structure now looks complete but with the possibility that it also projects into December. Each of the important declines that start above the final price low project subsequent peaks, and because the most recent projections had little or no effect it would seem that the new recent structure is now more dominant.
The rapid movement upwards through the 2 rising lines from the March and September 2000 peaks adds to the strongly bullish picture. Those previous lows in the 2320s and 2420s are now significant moving forward. Look out for those levels if they are re-visited in the future.
We continue to watch the oscillators for clues, but allow price to be the leading indicator.
–
Be prepared for what is coming next:
For more detailed ongoing analysis of the developments in the S&P500 index on a daily basis, as well as my personal Buy and Sell Signal trigger levels, please Sign up for daily Alerts & Observations. This includes access to the Members Area for an archive of all of my alerts and updates and my Explanatory Notes pdf which gives detailed explanations on all of the concepts being discussed.