
Remember, remember the fifth of November,
Gunpowder treason and plot.
We see no reason
Why gunpowder treason
Should ever be forgot!
(Traditional English Rhyme – 17th Century)
–
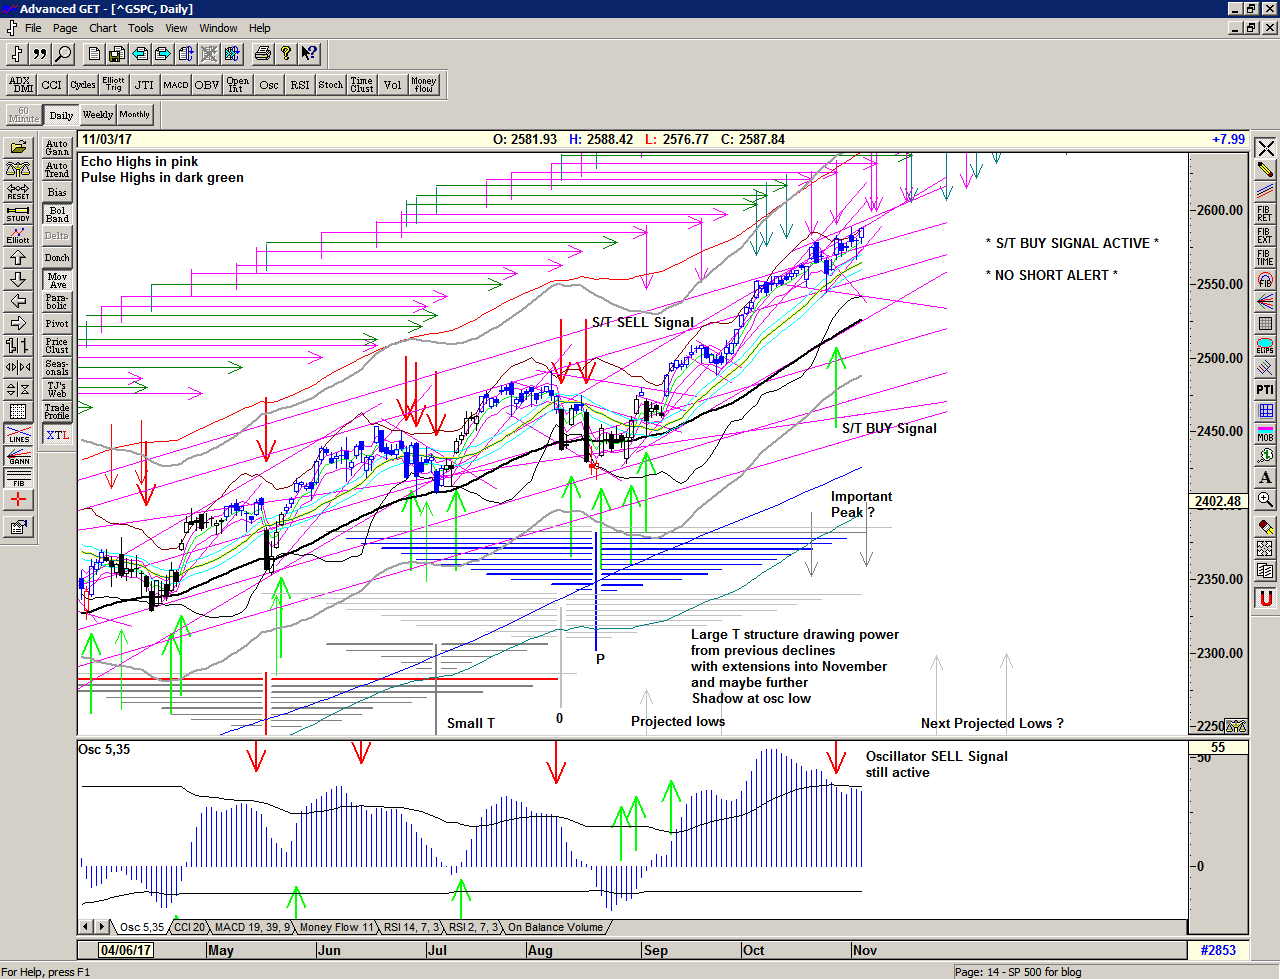
The market breezes effortlessly higher to close another week at a new all time high for the 3rd Friday in a row.
As you can see we are very close to the main projection of the current T structure and we also have an echo high scheduled for early this week.
Whether this T structure can continue to draw strength from the earlier declines in March, April and May remains to be seen. It is usual to see the main strength of the T structure expire at the projection point where the previous declines are no longer higher in price than the centre-point, but this T structure has activated a very long cash-build up line allowing for a much larger structure and potentially drawing strength from as far back as March.
Interestingly, both of the oscillators remain negative, even though they both have recently showed some signs of recovery, and yet the market closed at a new all time high and the VIX drops down to an historic low. Are we close to exhaustion – maybe? Is protection cheap?, yes.
Save the image to your desktop to view a larger version
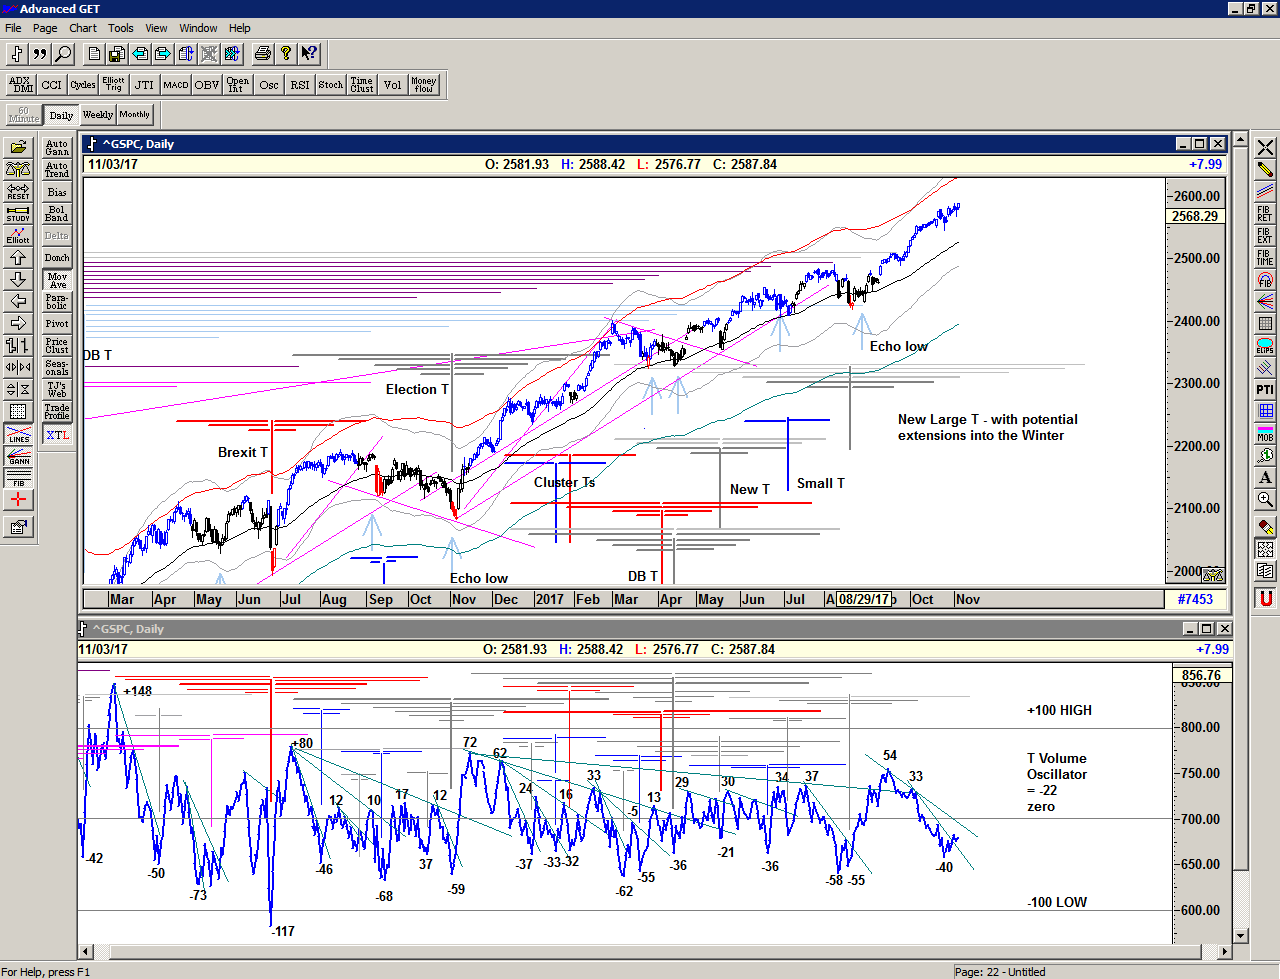
The T volume oscillator shows a recent cash-build up line since the peak in the oscillator at 54 in mid September at 2500 and now some signs of stabilisation. This is a smaller T stucture in construction and when it breaks higher will provide significant fuel for the next advance. This is interesting because it shows that the market has been taking profit on the recent advance and is preparing to re-cycle those profits.
Because the T volume oscillator moved upwards to 54 through the longer cash-build-up line that goes back to the oscillator peaks in November and December 2016, we have the possibility of a much, much larger T structure that may extend into the New Year.
With the oscillator currently at a low level, and the possibility of a much larger T structure, although there are distinct possibilities of a pullback in price, I believe that we should continue to be bullish in the weeks and months ahead.
Save the image to your desktop to view a larger version
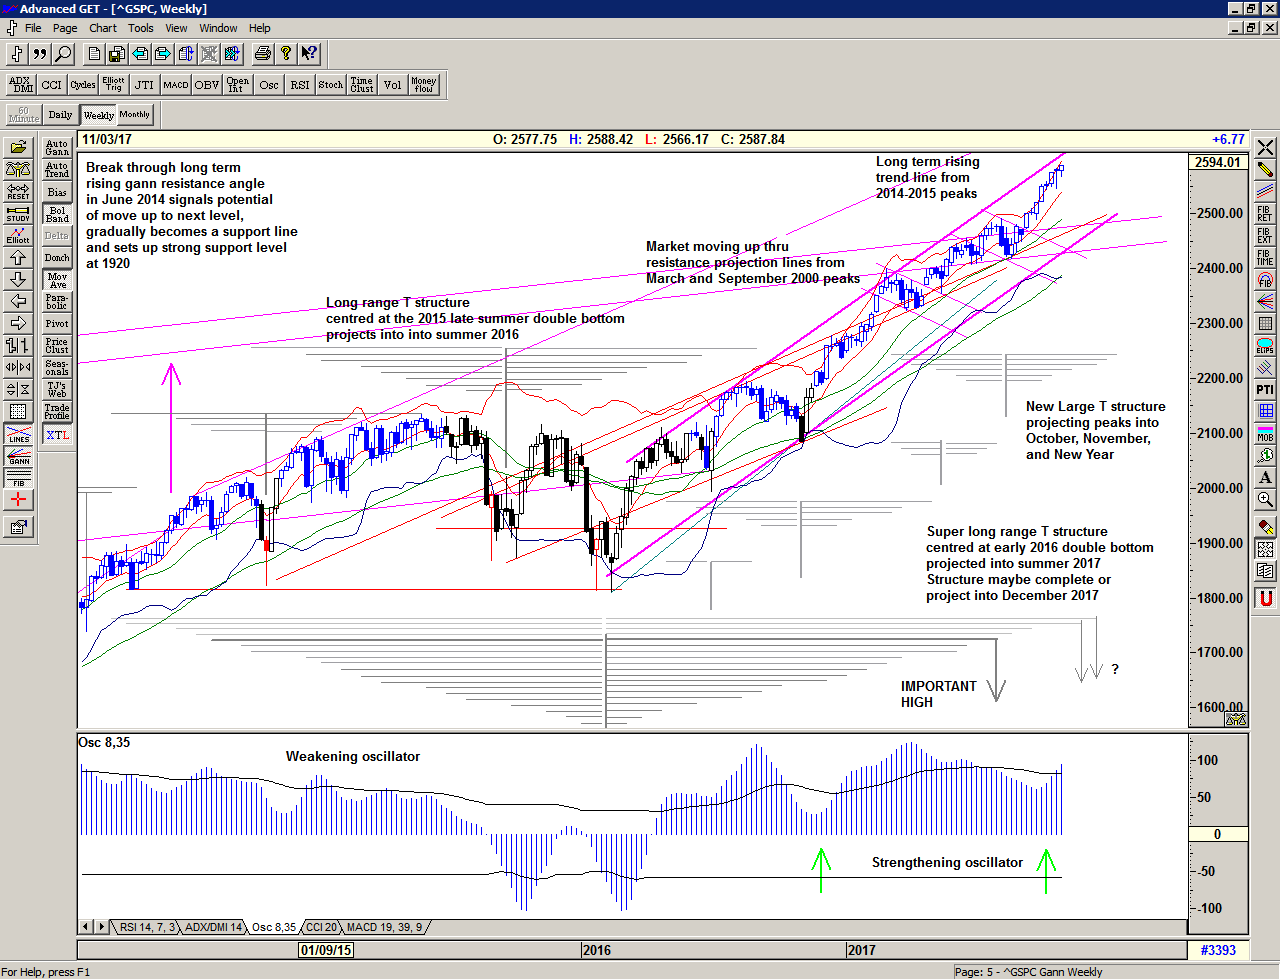
Zooming out to the bigger picture on a weekly chart. The market is very much contained within a strong upward channel. We are close to the upper reaches but not excessively so. It looks like the longer term objective of the current trend is the rising trajectory from the 2014-2015 peaks. Notice that the rollover period into the 2016 lows took a great deal of time and that it was accompanied with a visible deceleration in momentum and a gradual rounding off of the rising trend. These are longer term considerations that are not currently visible but should be watched out for in the months ahead.
Save the image to your desktop to view a larger version
Be prepared for whatever comes next and trade with confidence:
To receive detailed daily analysis, guidance and the updated daily Buy / Sell trigger levels being generated by the Trading the Line system before the market opens, and intraday alerts when appropriate, please become a Member and Sign up for Alerts & Observations – includes access to Members Area and the Explanatory Notes for all of the concepts discussed.
Disclaimer: This is the diary of a personal trading system, its methodology and the signals that it is producing. You are welcome to follow along but please understand that the information presented here is for educational purposes only. No recommendations are being made to buy, or sell stocks, options or futures contracts. Please consult your own financial advisor before making any investment decisions.