
Welcome to the Trading the Line Special Report.
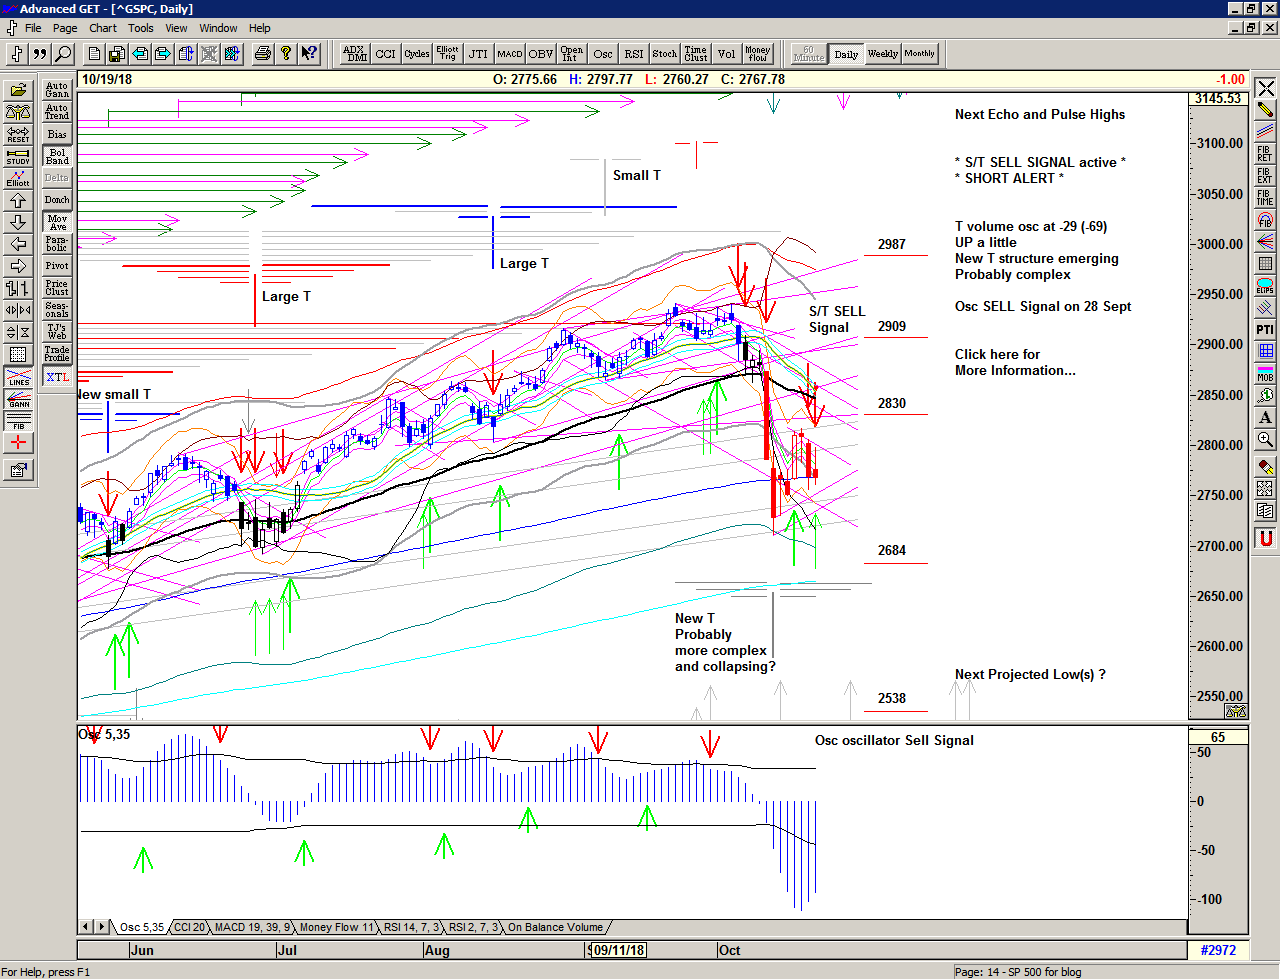
A series of late September Buy Signals failed to extend the market beyond the 21 September high with late day selling hinting that price had a problem and finally on 04 October price broke down creating the first Sell Signal since mid August and then over the next few days price plunged.
Price quickly found itself below the important 200 day moving average and bounced at the lower extreme of the channel, where some support has been found and a (perhaps temporary) low has formed.
The initial strong move up created a Buy Signal and defined a small T structure that has been short-lived as waves of selling into strength have been the result of such a forceful drop in the market.
Save the image to your desktop to view a larger version
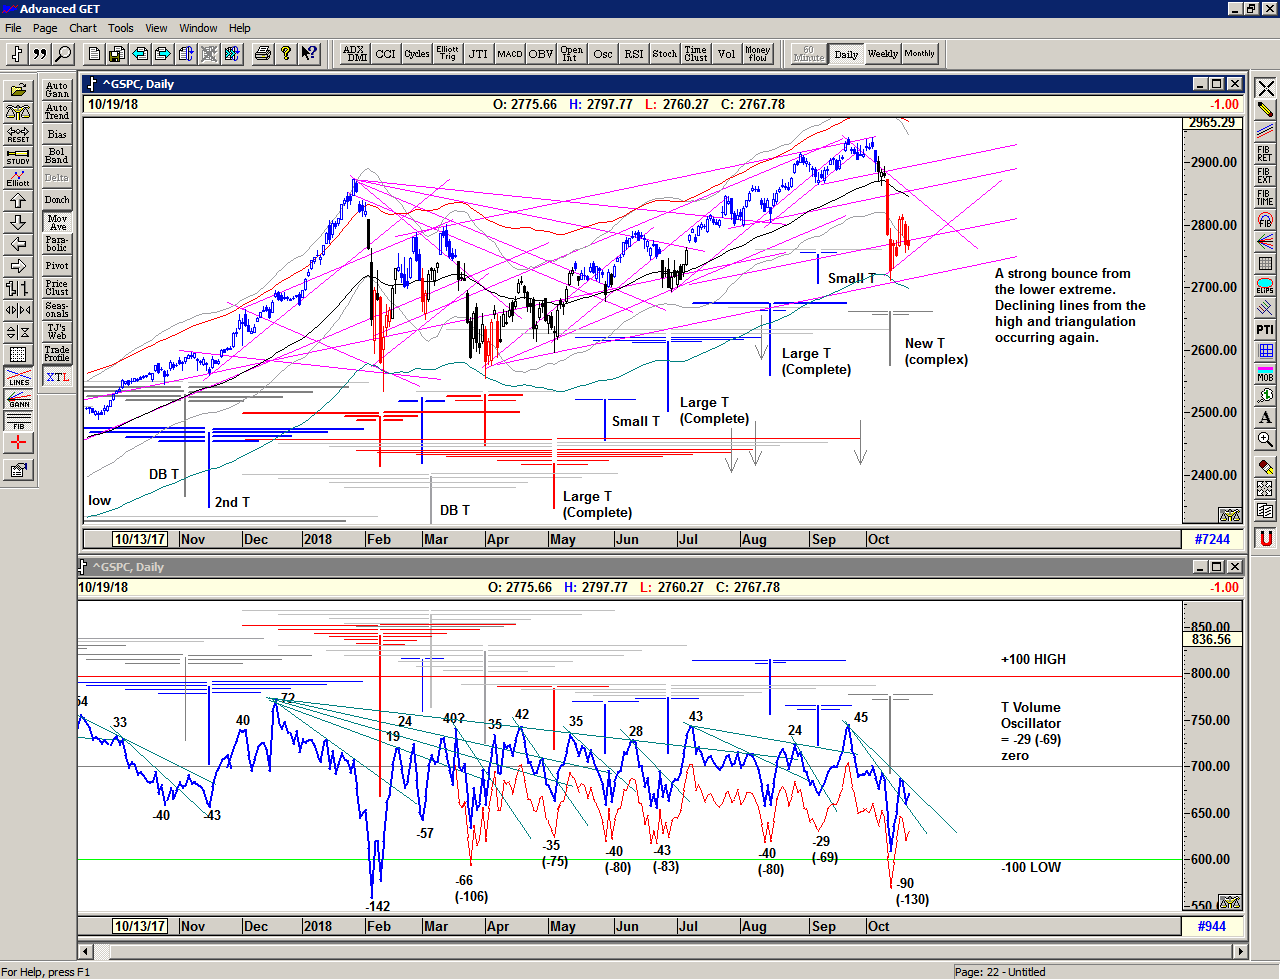
As we can see from the chart below with the T volume oscillator, a series of large T structures were pointing to a completion in the September time-frame and although sometimes these structures continue to extend, they ultimately come to a conclusion, and that is usually a drop in the market. This is due to a lack of buying pressure at the end of a T structure.
The recent bounce has come at a 'logical' support area near previous lows and on rising trend lines from the previous lows and the move itself is not disimilar to the February one.
And so, we should of course be prepared for an erratic, volatile and choppy recovery, followed by more harsh selling, perhaps a series of lows (higher or lower) and ultimately, some kind of re-establishment of the trend…
Or, this is a Warning – a shot across the bows – and the beginning of a more serious decline, a Bear Market if you will, depth and length unknown.
Fortunately we do not need to know the answer, because the S/T System allows us to trade the market without the prejudice of prediction that would likely inhibit us.
Save the image to your desktop to view a larger version
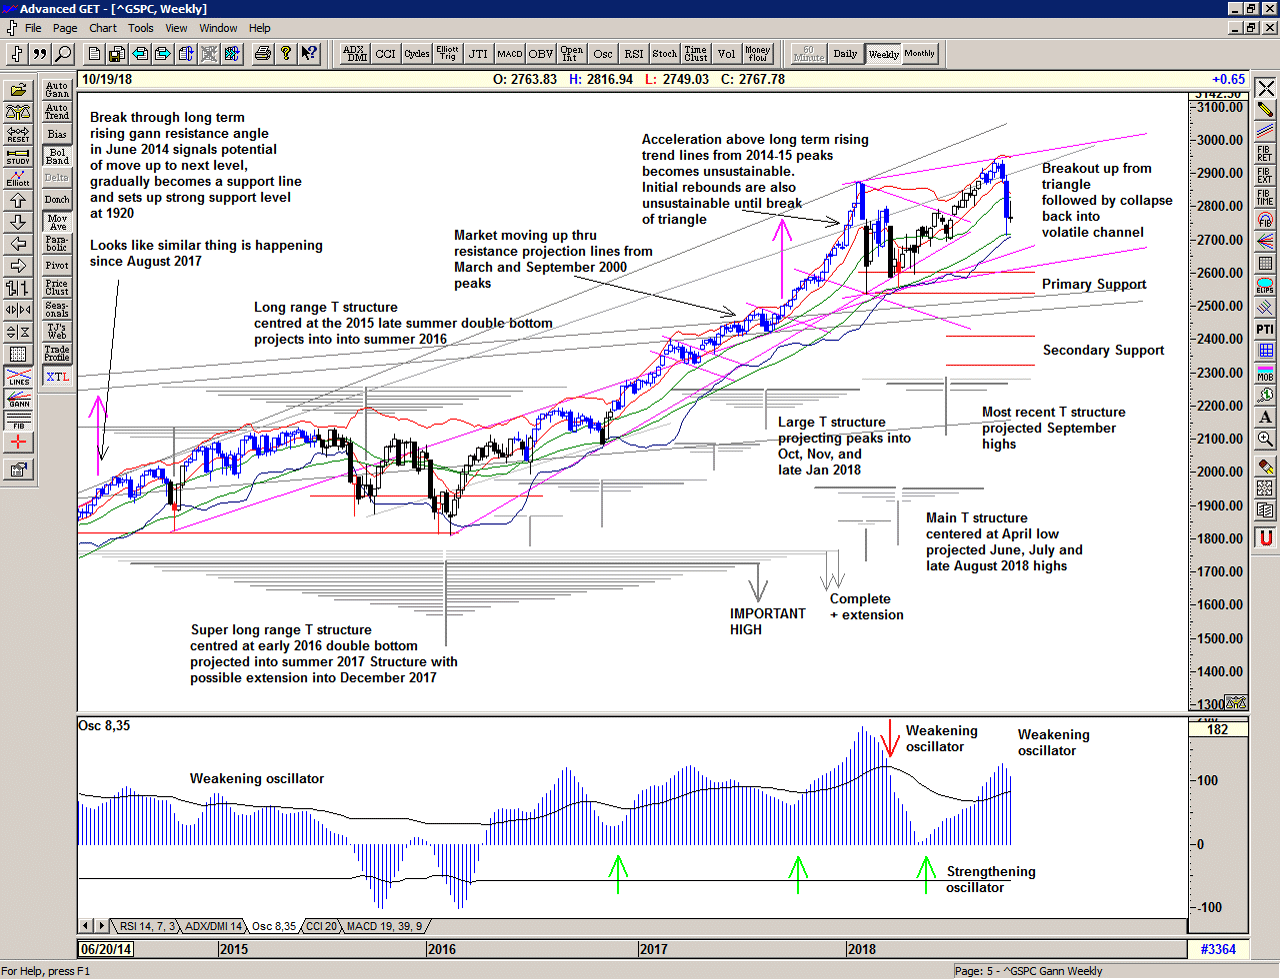
Zooming out to the weekly chart, we can see price became unsustainable again above a very long term trend-line from the 2014-2015 peaks ultimately triggering price collapse into a volatile channel.
For now I am still seeing this as a process, initiated when price climbed above 2475 or so. Price then rises as high as possible before collapsing and re-defining its support levels. Look back to the bearish phases in 2015-2016 to see how price processed the highs and established some very strong support levels which then became a platform for moving higher.
Save the image to your desktop to view a larger version
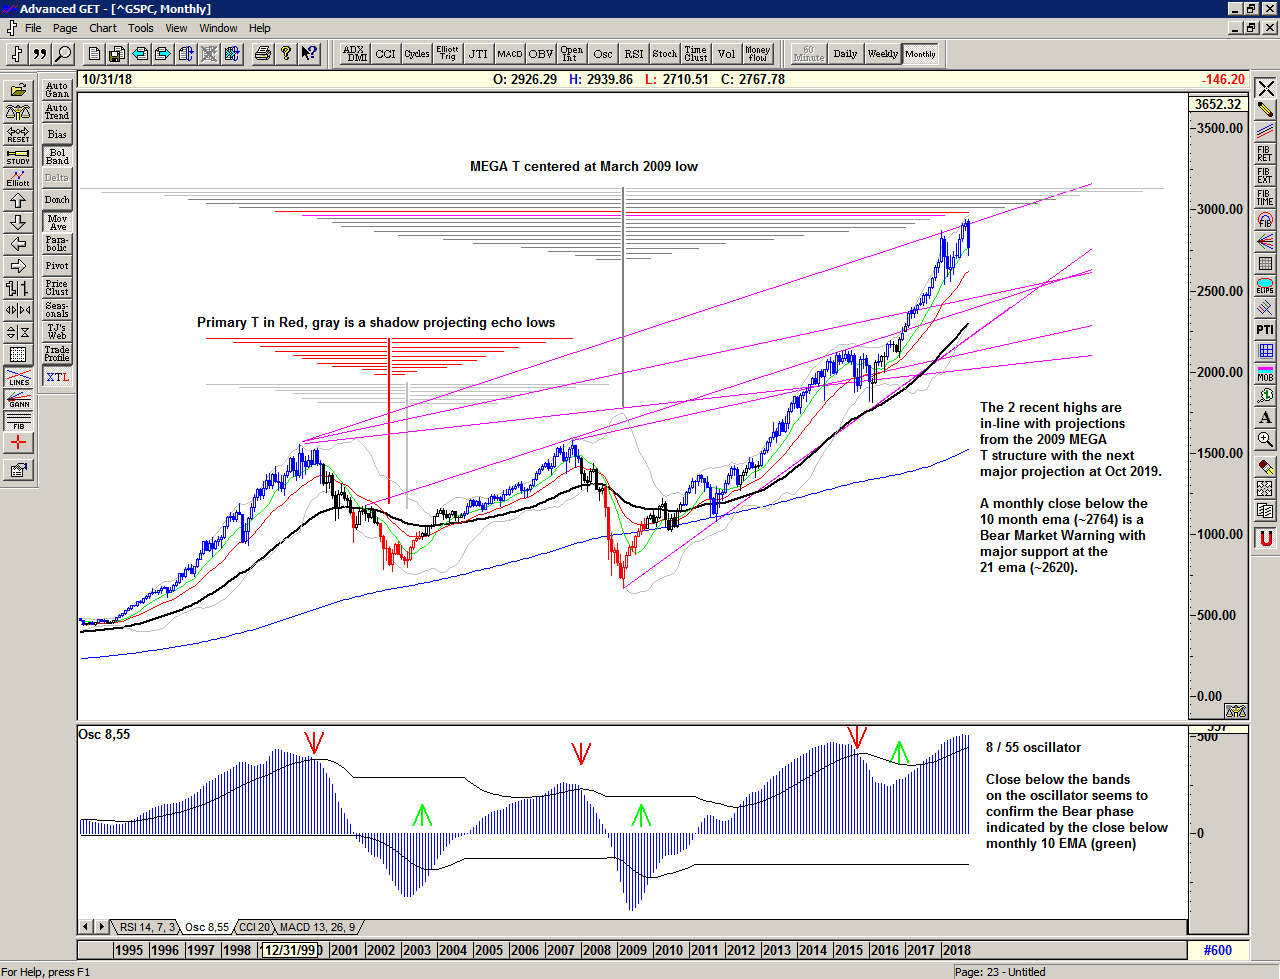
It is interesting to look at the much larger time frame occasionally, and on the monthly chart below we can contextualise the market in relation to its historical lows in 2002 and 2009.
It is clear that the market has been rising generally since the low in March 2009, and therefore within the right-hand side of a Mega T structure. According to this we have just seen a projected high from the April 2000 peak in January-February of this year (pink), and subsequently another projected high from the July 1999 high (red). This is potentially the momentum peak of the Mega large T structure. Another wave from the July 1998 high would project another major high in October 2019 – not necessarily a higher high though, but it could be.
As you can see the market is generally supported at its 10 month exponential moving average (ema) during bullish phases and subsequently at its 21 ema on major pullbacks. If the market is to enter a serious Bear Market it must then continue to decline below the 21 ema. Note also that the long-range 8 / 55 oscillator also provides a confirmation of the change in momentum.
For now, a Bear Market Warning is flashing but a monthly close above 2764 would improve that outlook.
Save the image to your desktop to view a larger version
All in all, 2018 continues to bring with it some excellent opportunity and a range that is far beyond the experience of recent years. We should expect it to continue and trade accordingly. This is a Brave New World.
–
Regardless of whether the market can recover or whether deeper low(s) are ahead of us, the simplicity of the proprietary price based S/T Signalling System continues to keep us on the correct side of the market, providing a timely Sell signal at the beginning of October. Recent Buy Signals have rapidly switched back into Sell Signals as the market continues to stabilise and the outlook continues to look murky…
If you would like to learn more about using the S/T Signalling System please get in touch.
–
Be prepared for whatever is coming next, and trade with confidence:
To receive detailed daily analysis, guidance and the updated daily Buy / Sell trigger levels being generated by the Trading the Line system before the market opens, and intraday alerts when appropriate, please become a Member and Sign up for Alerts & Observations – includes access to Members Area and the Explanatory Notes for all of the concepts discussed.
Disclaimer: This is the diary of a personal trading system, its methodology and the signals that it is producing. You are welcome to follow along but please understand that the information presented here is for educational purposes only. No recommendations are being made to buy, or sell stocks, options or futures contracts. Please consult your own financial advisor before making any investment decisions.