
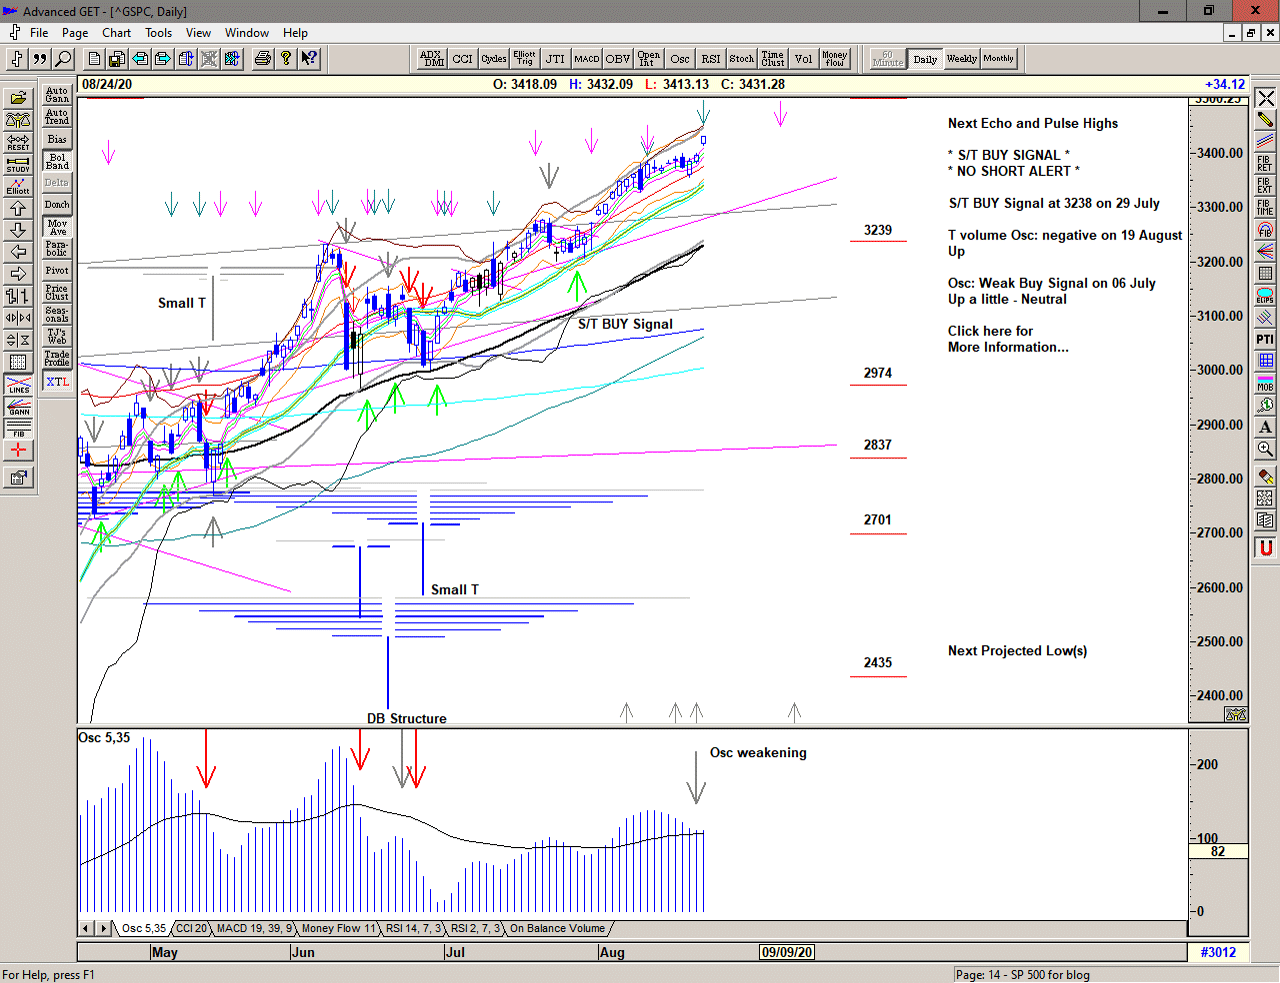
A major consolidation and a double bottom above 3000 in June. An S/T Buy Signal on 30 June at 3067 and a push up into 3280. Another consolidation above 3200 leading to the current S/T Buy Signal on 29 July at 3238 and a dog days steady grind higher to new all time highs.
The DB (double bottom) structure formed at the June lows continues to stretch higher and ultimately is seeing 3400, and is at yet another projection for a high. But is it running out of energy?
There are certainly signs of bearish divergencies between the bullish price action and buying power as defined by the T volume oscillator *. The market has also continued for several weeks to exhibit extreme complacency and price is at levels that would normally trigger heavy profit-taking. And maybe it will – at some point. This is, of course, a market that is far from normal, even before the collapse earlier this year due to the unforeseen events and the extraordinary measures taken. This is, of course, a Brave New World not dissimilar to the visions of Aldous Huxley and George Orwell. We should therefore continue to expect and respect the extraordinary and trade accordingly.
A Buy Signal continues for now, but… Whatever next?
Save the image to your desktop to view a larger version
The late June decline into the 2nd low formed a deep low in the T volume oscillator * and a 'double bottom' that confirmed at least a new small T structure or DB structure with the rise in the oscillator up through the cash build-up line** formed by the series of declining highs in the oscillator.
Previous highs in both price and the oscillator project potential highs via the important low, and as long as price performance continues to be bullish we can assume that the structure is intact. There was an important projection for a high on 13 August and subsequently another one here and now. We are therefore on lookout for a break in the structure.
We now see the T volume oscillator declining and falling away below zero, whilst price continues to be bullish and this 'bearish divergence' alerts us to the possibility that distribution is occurring in the background and that the structure may be nearing completion.
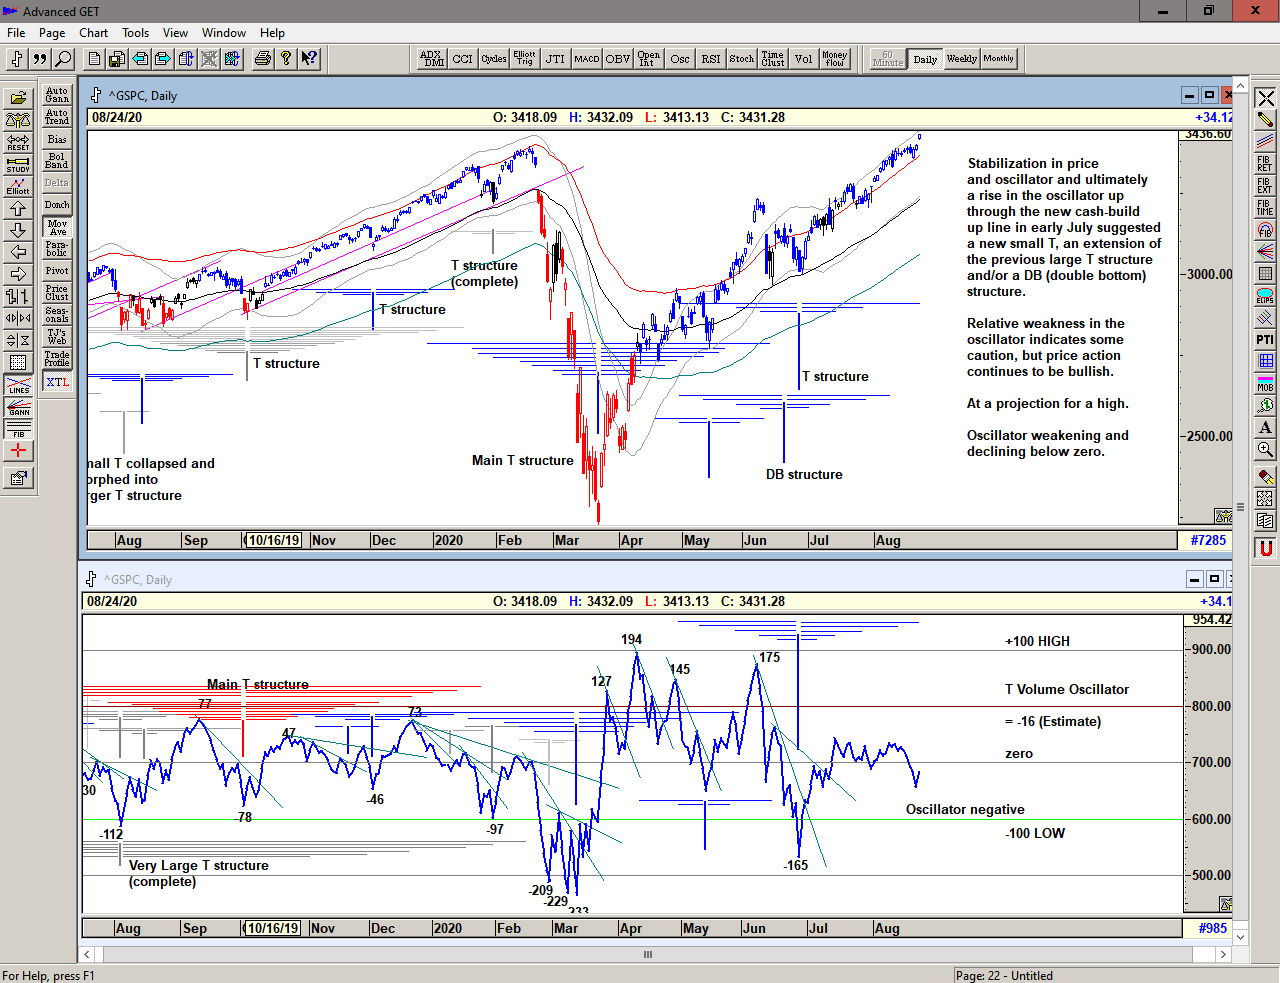
Strong, resilient structures can take many days to complete, and often move far beyond expectations,until price has exhausted itself. Keep one eye on the wheel and the other firmly on the road ahead as we look forward to the next phase developing.
* The T volume oscillator is an indication of Buying Power within the market as a whole
** The cash build-up line is a declining line drawn above a series of lower highs made in the oscillator.
Save the image to your desktop to view a larger version
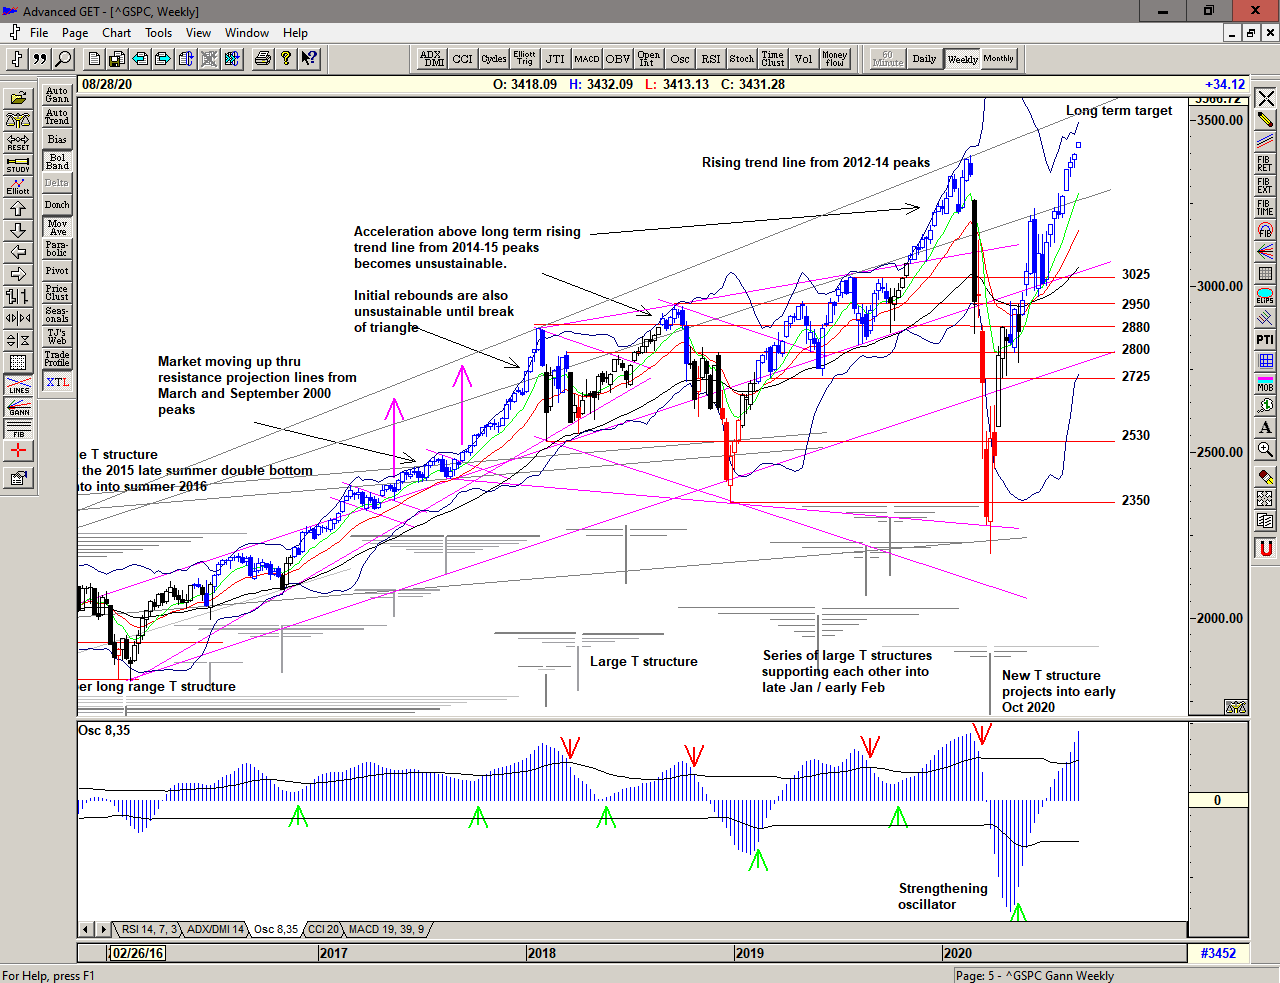
Zooming out to the weekly chart, we can see that the recovery off the March low reached the important rising trendline from the 2014-15 highs before becoming unstable and is now moving up towards the longer term target – at the rising trend line from the 2012-14 peaks.
That upper trendline has triggered major price reversals and should therefore be treated with extreme caution once reached.
Note also the expanding triangle structure as the market has become increasingly dynamic since the Fall of 17.
Save the image to your desktop to view a larger version
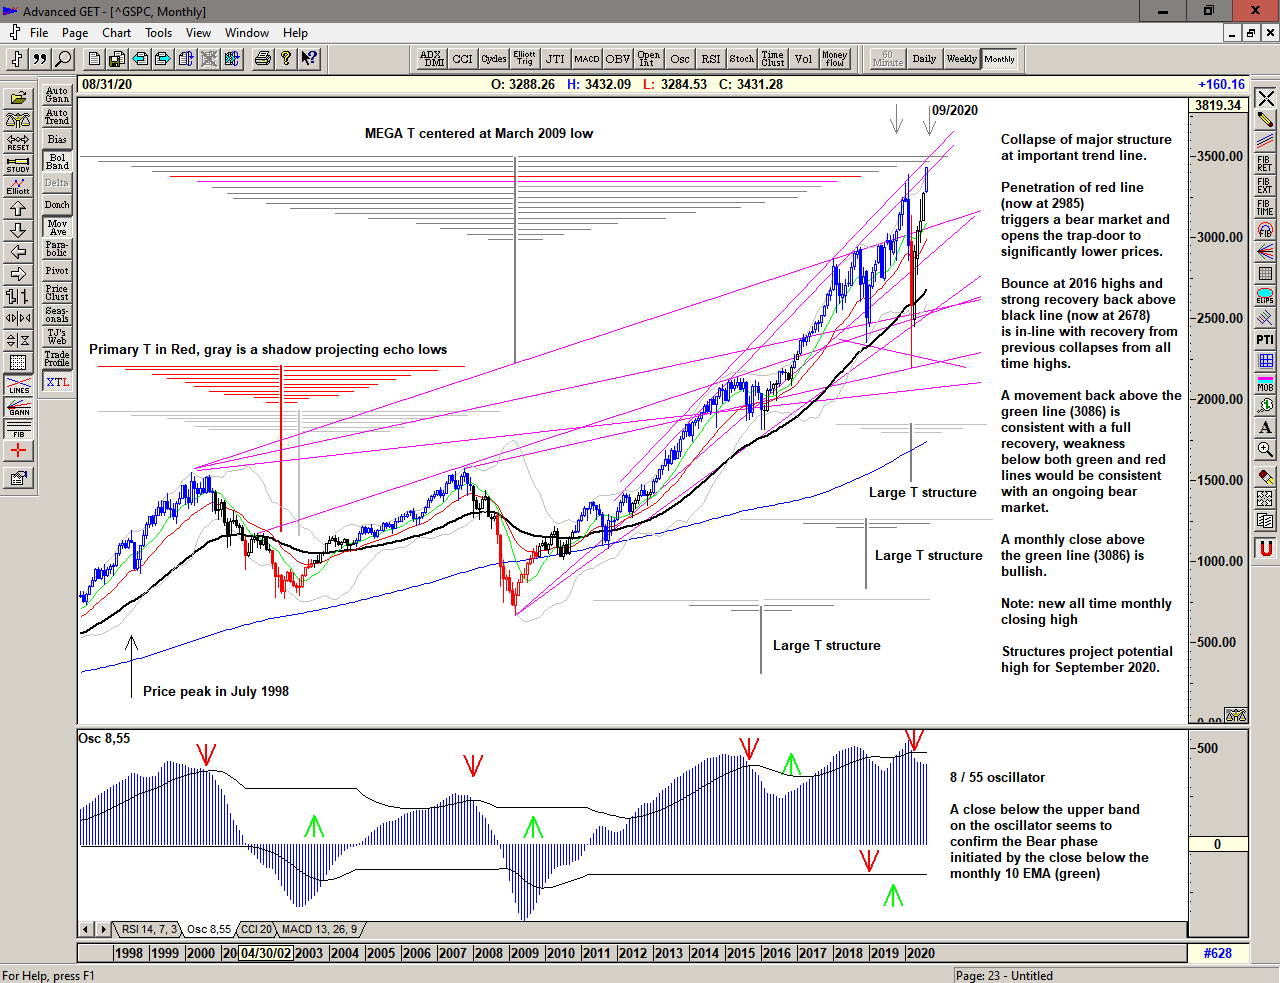
The monthly chart shows the market back on the parabolic trajectory that it was on prior to the February and March collapse. Several of the larger structures project highs for next month but the price action continues to be strongly bullish.
The long term oscillator although weakened by the collapse looks like it is strengthening again.
Save the image to your desktop to view a larger version
2020 is bringing some fast and furious action in the market with a range that became increasingly expansive since the move above 2500 in the Fall of 17. We can only assume that this will continue. This is a Brave New World.
–
Regardless of whether the market can continue higher or whether significant lows are ahead of us, the simplicity of the proprietary price based S/T Signalling System will continue to keep us on the correct side of the market, with price currently on a Buy Signal since moving above 3238 on 29 July 2020.
If you would like to learn more about using the S/T Signalling System please get in touch.
–
To receive detailed daily analysis, guidance and the updated daily Buy / Sell trigger levels being generated by the Trading the Line system before the market opens, and intra-day alerts when appropriate, please become a Member and Sign up for Alerts & Observations – includes access to Members Area, Explanatory Notes (pdf) for all of the concepts discussed, and Notes on Day Trading (pdf)
Disclaimer: This is the diary of a personal trading system, its methodology and the signals that it is producing. You are welcome to follow along but please understand that the information presented here is for educational purposes only. No recommendations are being made to buy, or sell stocks, options or futures contracts. Please consult your own financial advisor before making any investment decisions.