
All numbers refer to SPX
…
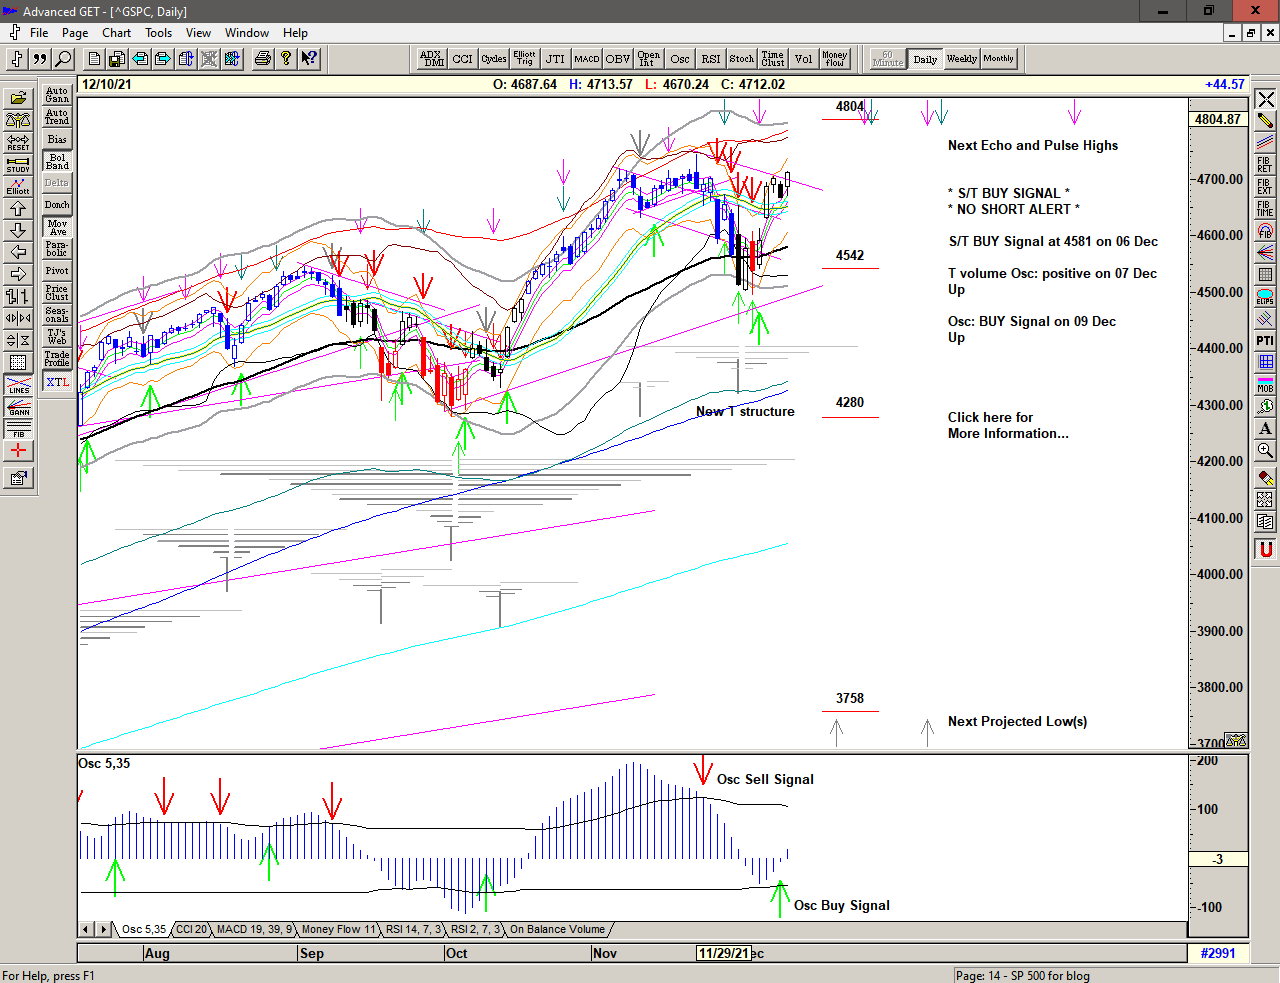
Some very strong buying since making lows around 4500 on 01 and 03 December quickly taking the market back to the all time highs.
A new Buy Signal at 4581 on 06 December and a new active T structure.
Should we expect further highs?
Save the image to your desktop to view a larger version
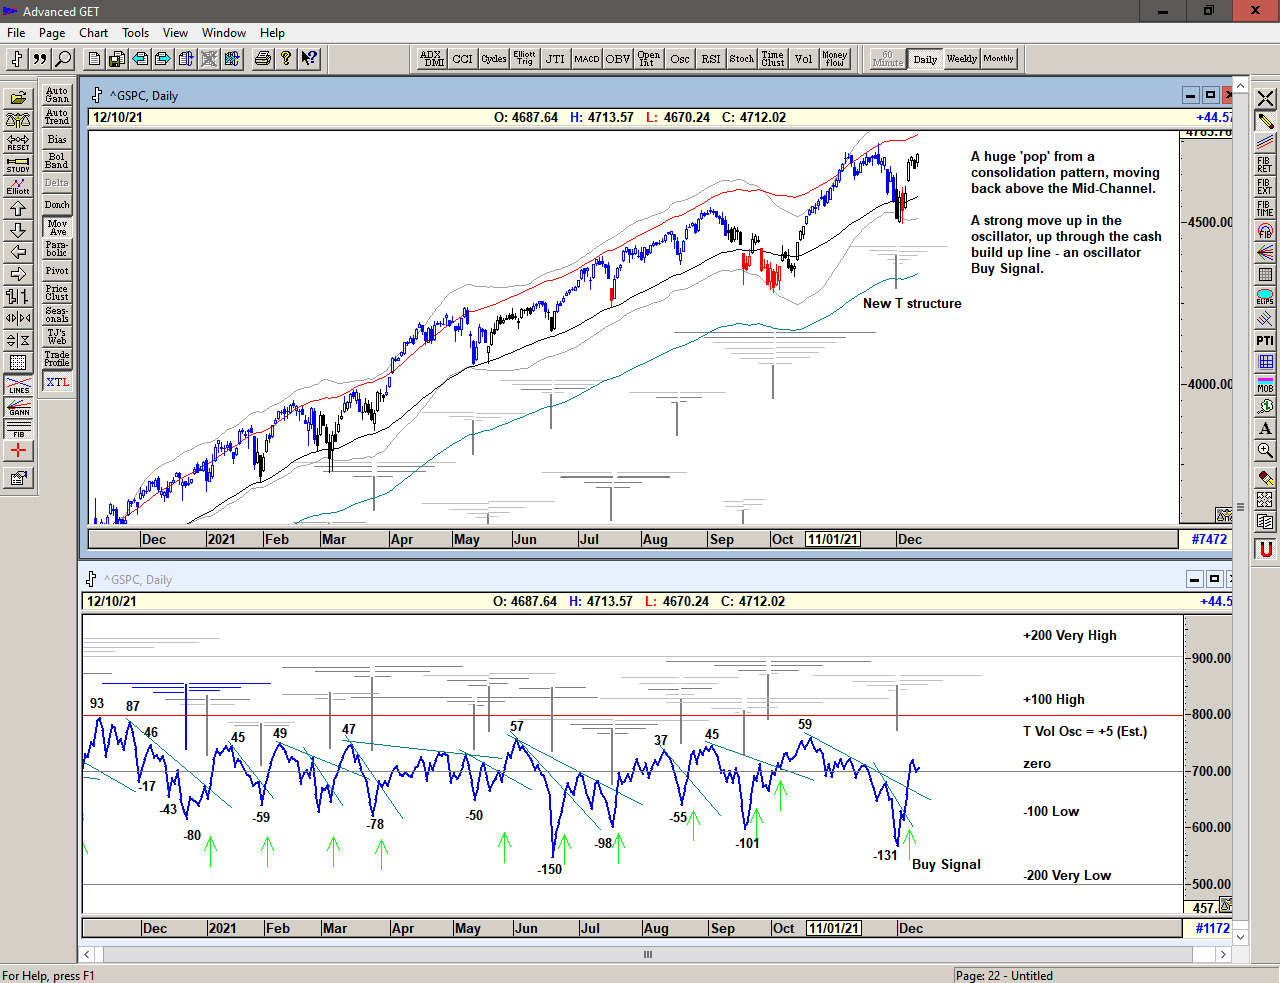
Very strong and intimidating price action intermixed with some sharp selling as the market muscles its way higher.
Save the image to your desktop to view a larger version
The T volume oscillator 1 started to deteriorate after 09 November and especially after 17 November, in-line with previous projections for a high giving some warning of the subsequent selling. Having made a low with the heavy selling on 01 December, the oscillator then made a Buy Signal on 06 and 07 December with a strong move up through the declining cash build up line2 of the oscillator indicating the potential for a large T structure emerging
The oscillator projects strength from the previous oscillator highs into the next series of highs via the oscillator lows, and the price highs also project strength from the previous price highs into the next series of price highs via the price lows. The T structures project the current highs with potential into the Christmas holiday and possibly beyong into New Year.
1 The T volume oscillator is an indication of Buying Power within the market as a whole
2 The cash build-up line is a declining line drawn above a series of lower highs made in the oscillator.
Save the image to your desktop to view a larger version
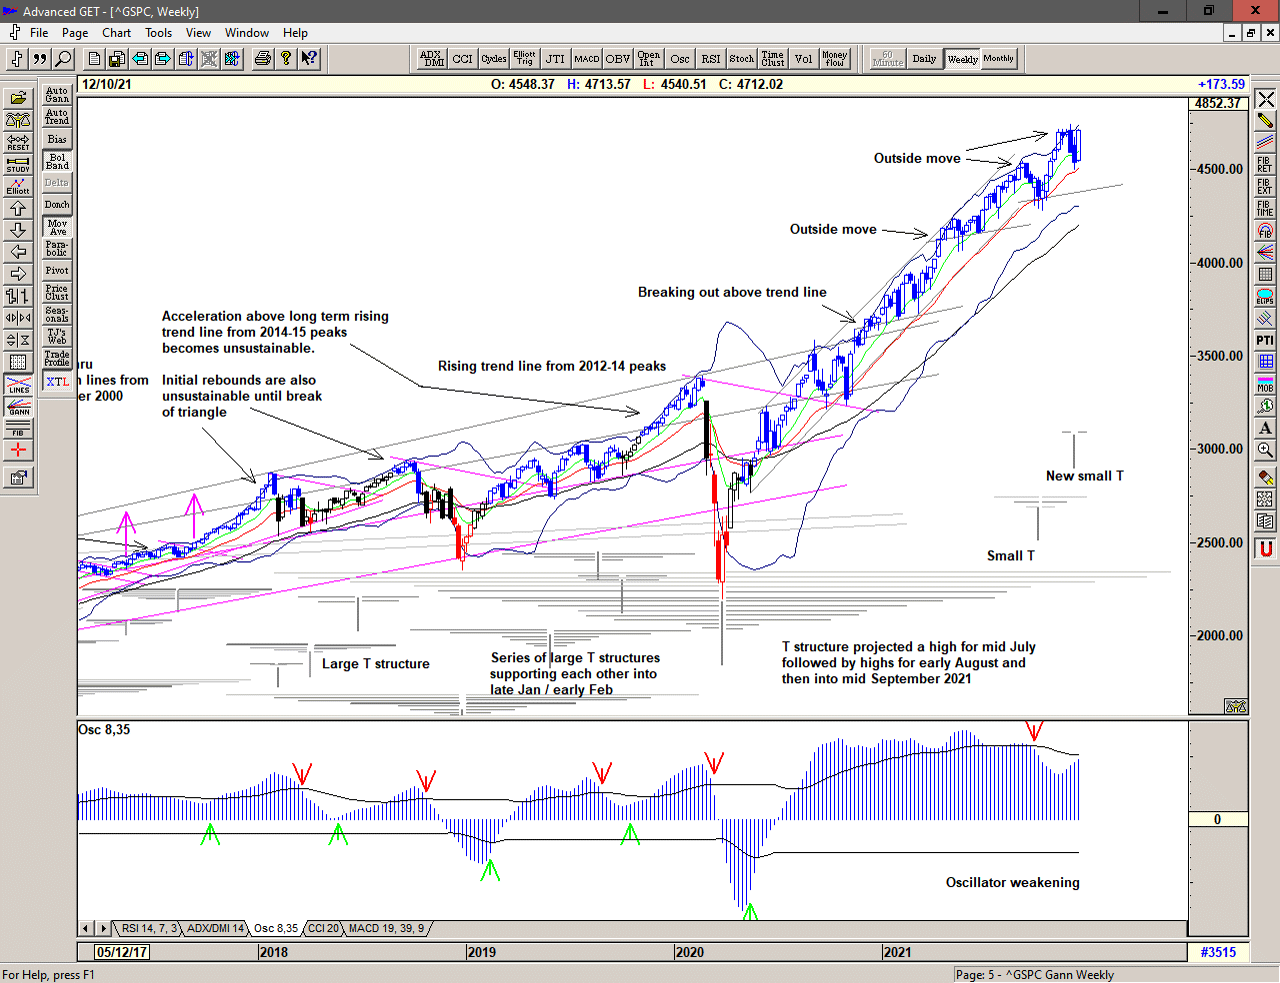
The weekly chart shows a strong recovery from the weekly 21 ema back to the high forming a new small T which projects strength into the week ending 24 December – also in-line with the small T at the previous low.
If the large T structure is still larger, we can project the next major highs for the week ending 07 January, with the possibility of longer projections into early April and mid-late May 2022.
The rising line under the recent lows is an important support line, and a significant break of that area would be a serious warning.
Save the image to your desktop to view a larger version
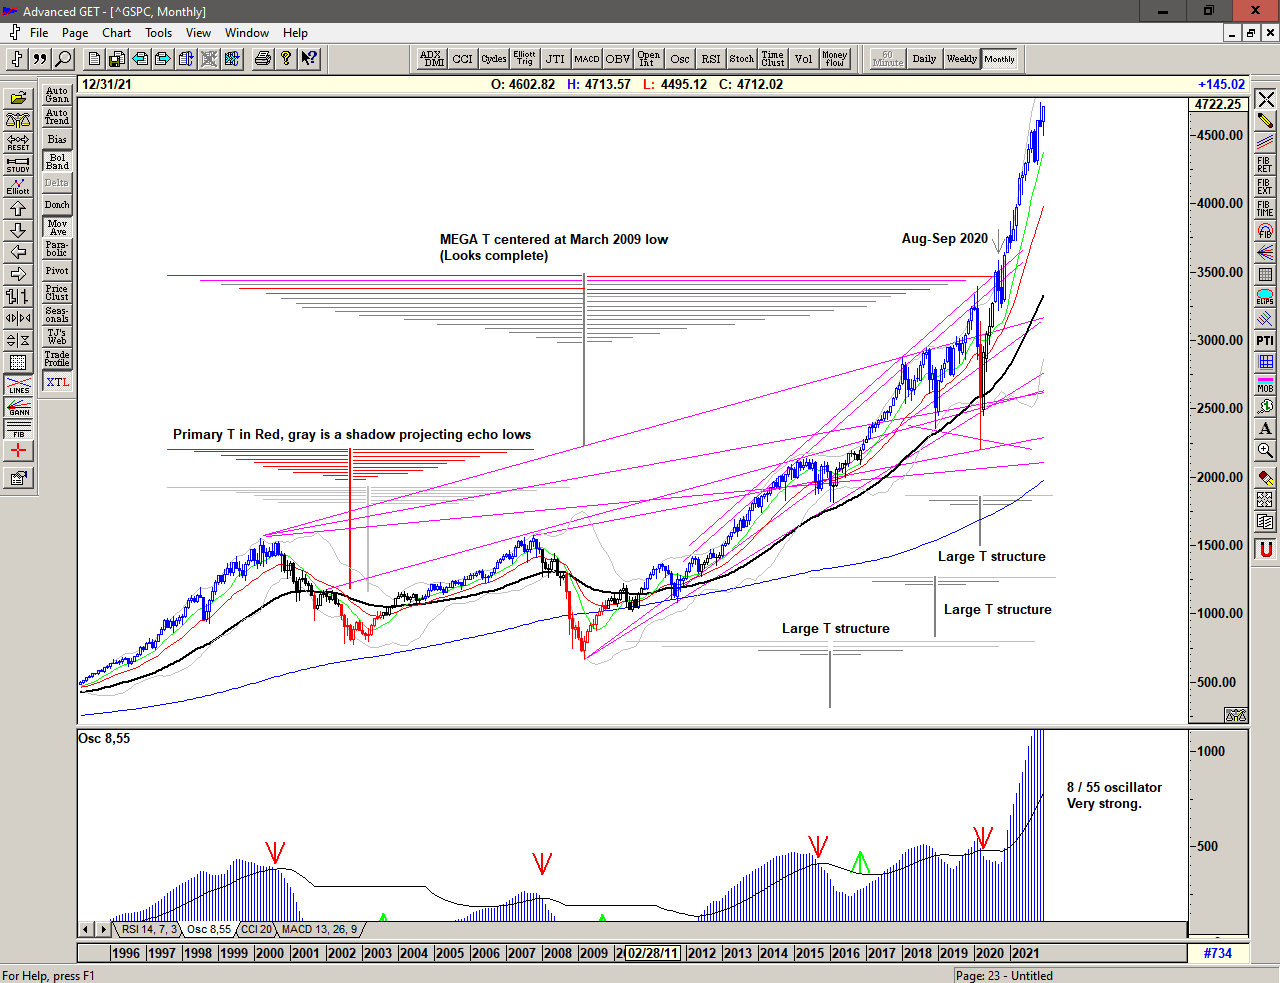
The monthly chart continues to show strength with a strong recovery from last months spike high. The previous high was in-line with the projection for a high from the large T Structure centered at the March 2020 low, which continues to project highs into March and May of 2022.
…
2021 continues with a range that has become increasingly expansive since the move above 2500. With price above 4500 we can only assume that this will continue. This is a Brave New World and we should trade accordingly.
–
Regardless of whether the market can continue higher or whether significant lows are ahead of us, the simplicity of the proprietary price based S/T Signalling System will continue to keep us on the correct side of the market, with price currently back on a Buy Signal since moving above 4581 on 06 December 2021.
If you would like to learn more about using the S/T Signalling System please get in touch.
–
Be prepared for what is coming next and trade with confidence:
To receive detailed daily analysis, guidance and the updated daily Buy / Sell trigger levels being generated by the Trading the Line system before the market opens, and intraday alerts when appropriate, please become a Member and Sign up for Alerts & Observations – includes access to Members Area and the 'Explanatory Notes' for all of the concepts discussed as well as the new 'Notes on Daytrading' which provides insight into how to look for shorter term entries and exits within the context of the S/T Signalling System.
Disclaimer: This is the diary of a personal trading system, its methodology and the signals that it is producing. You are welcome to follow along but please understand that the information presented here is for educational purposes only. No recommendations are being made to buy, or sell stocks, options or futures contracts. Please consult your own financial advisor before making any investment decisions.