
All numbers refer to SPX
…
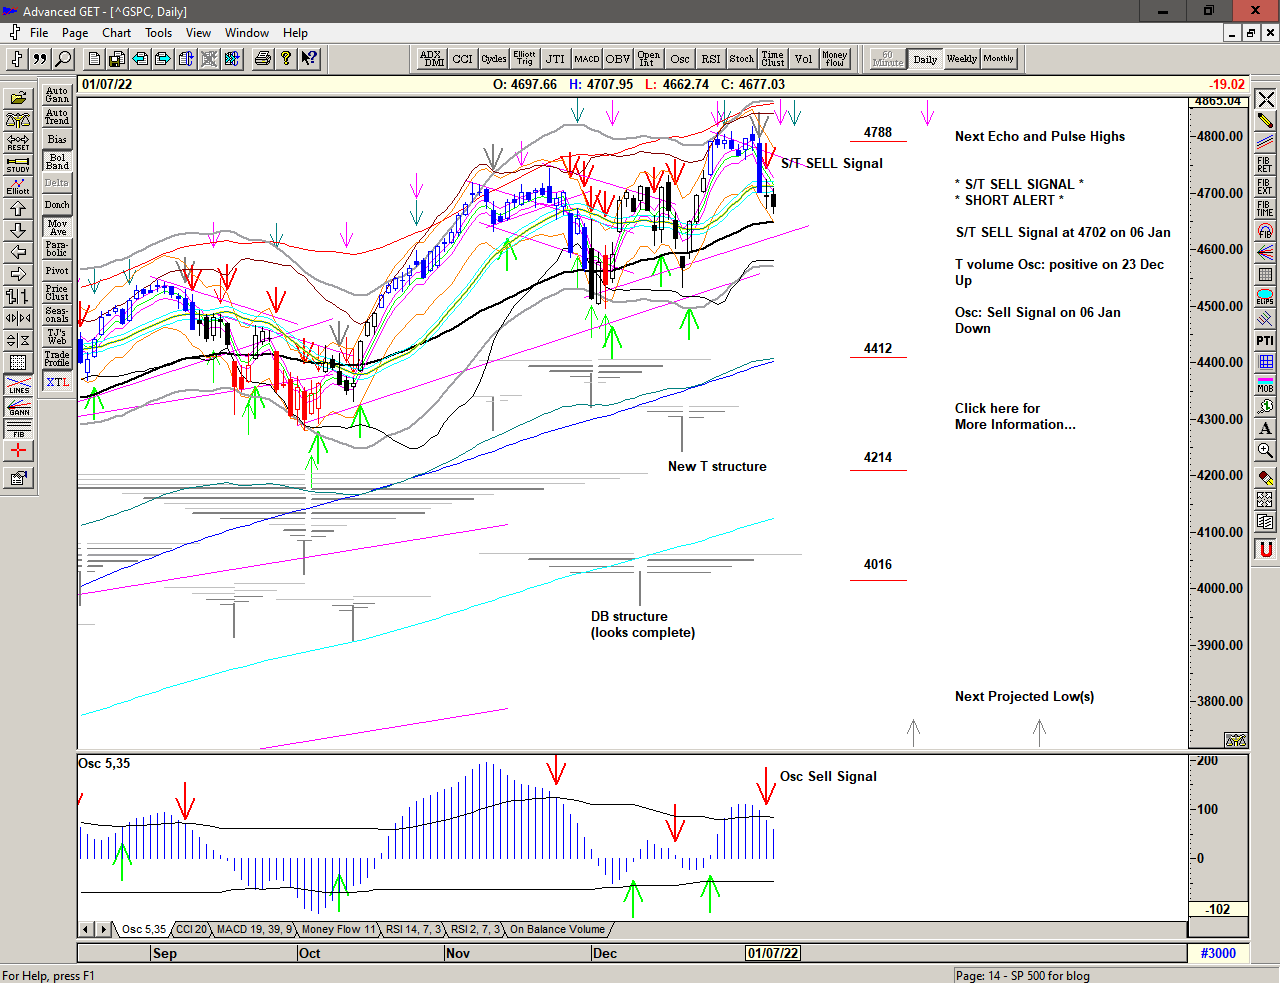
An extreme move up into the End of Year, followed by some very heavy selling.
Welcome to 2022.
Save the image to your desktop to view a larger version
A large DB (Double Bottom) Structure projected into 30 December and 04 January (and with potential into 13 January) collapses from the new all time high on 04 January and is heavily sold into in response to FED minutes on 05 January as traders rush for the exits.
Save the image to your desktop to view a larger version
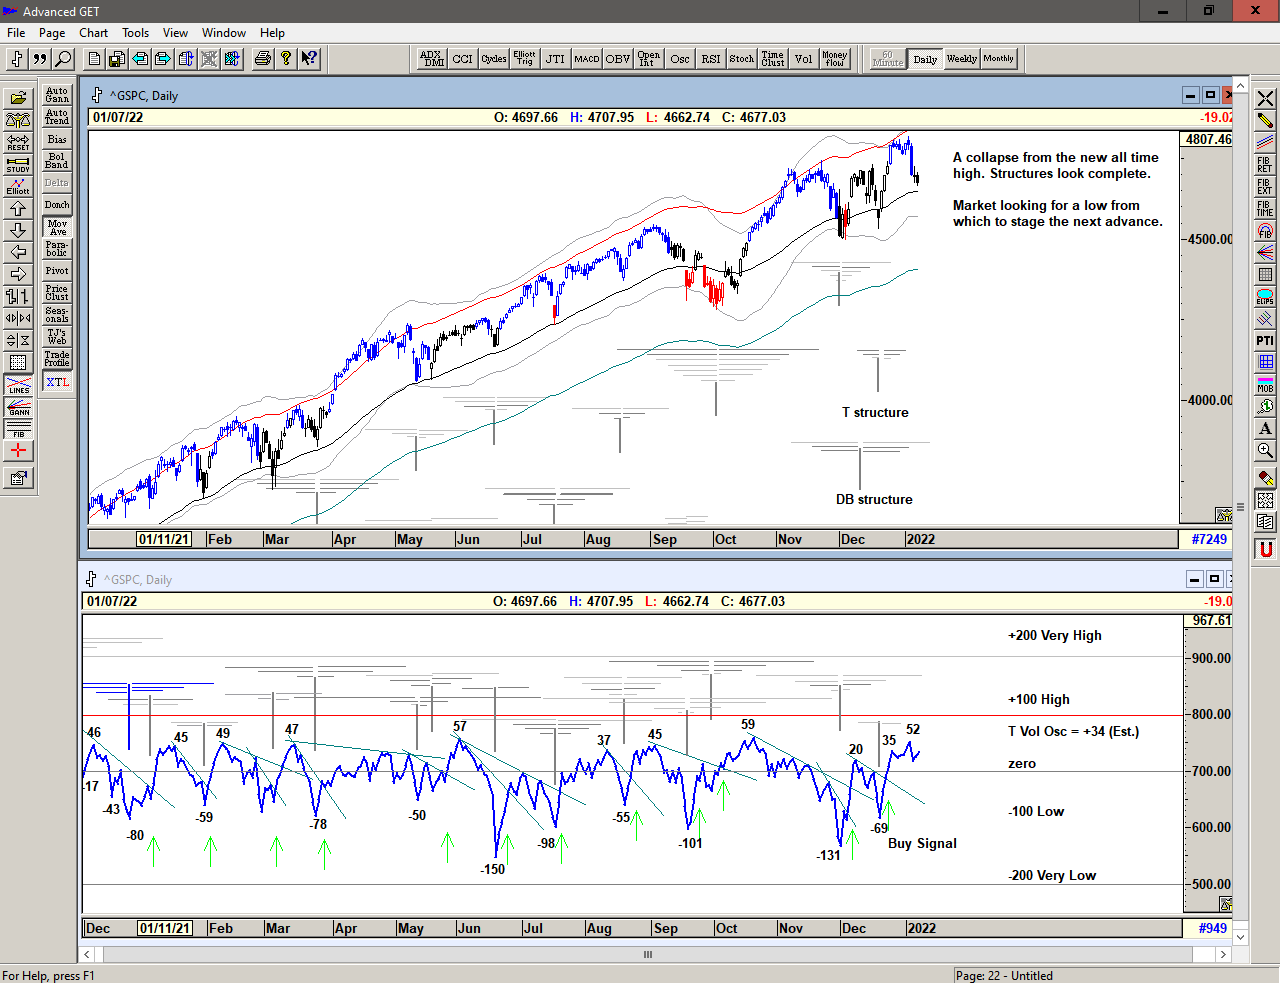
The T volume oscillator 1 made strong Buy Signals after the important price lows on 03 December and 20 December, with the oscillator moving up through the declining cash build up lines2 and confirming the prescence of active T Structures.
T Theory projects highs from the important price highs and the important oscillator highs with the amount of time spent declining from highs equal to that of the subsequent price rise.
Curiously, although the price has collapsed from the highs, the T volume oscillator is still positive. Either we have not seen the important low(s) yet and there is significantly lower prices ahead or the buying power remains relatively strong and recovery is imminent.
We are therefore prepared for a recovery but mindful of the potential for lower prices from this level.
1 The T volume oscillator is an indication of Buying Power within the market as a whole
2 The cash build-up line is a declining line drawn above a series of lower highs made in the oscillator.
Save the image to your desktop to view a larger version
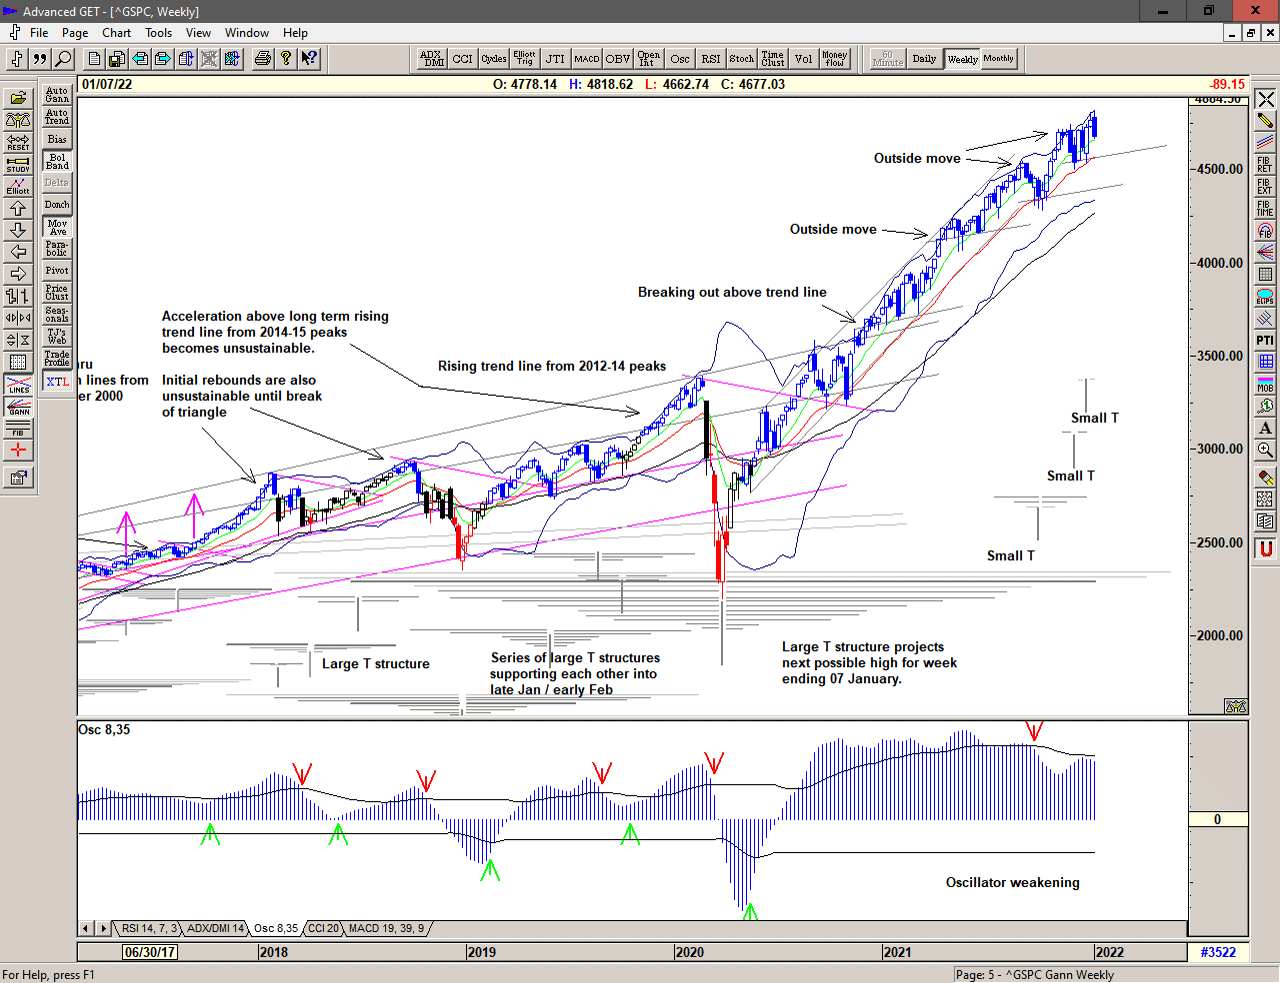
The weekly chart provides a bigger picture of the current Large structure centered at the March 2020 low and projecting the current high from the price peak in mid June 2018 and this would explain the current decline.
The logic of the structure would suggest further highs in early April and mid-late May of this year but with quite a bumpy ride in due course.
The bottom of the recent price rise and the rising trend line would be important levels to hold if this structure is to stay intact.
Save the image to your desktop to view a larger version
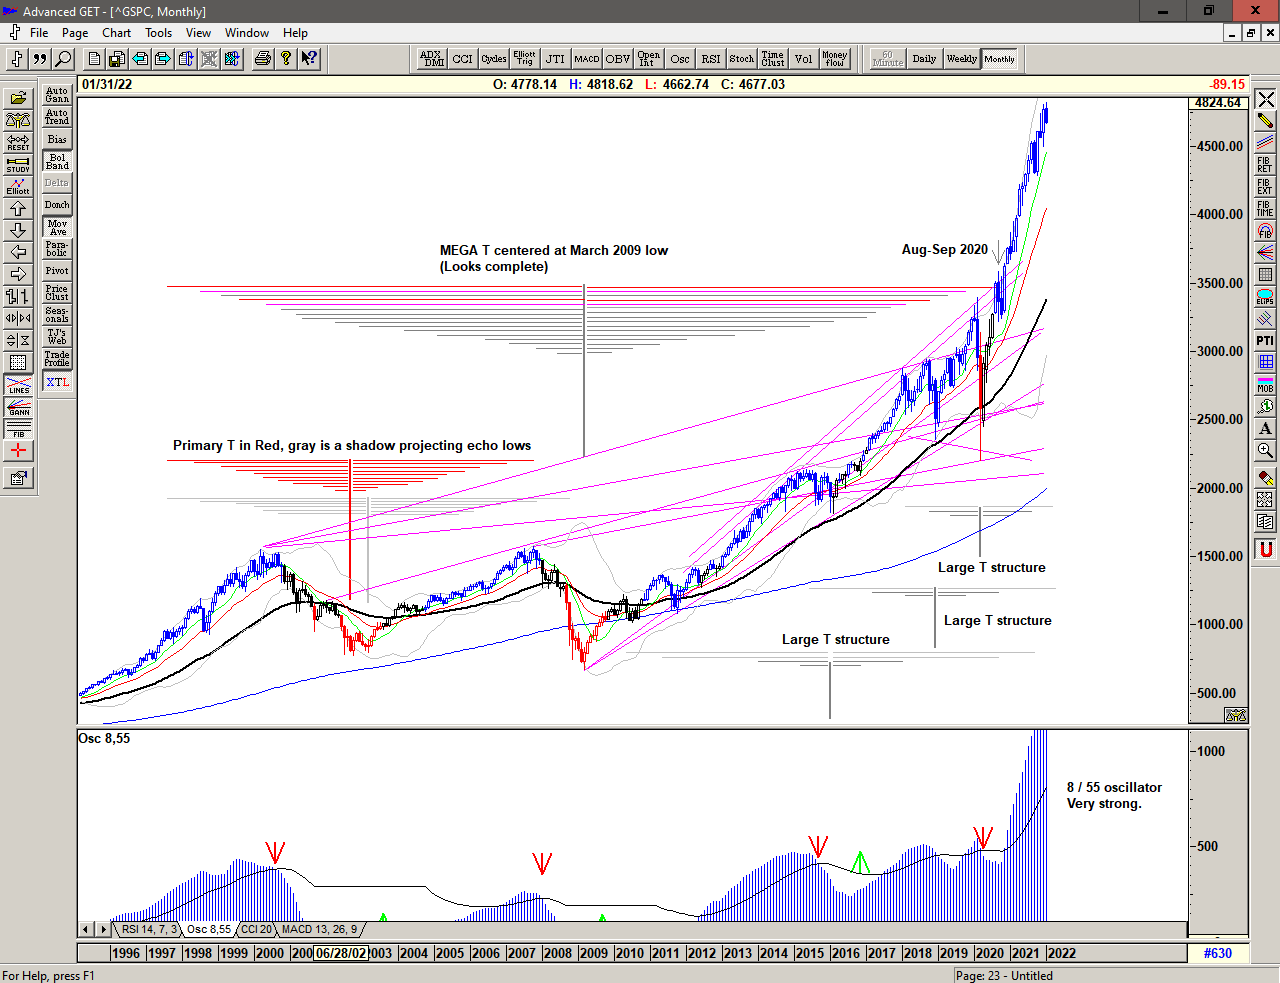
The monthly chart shows the series of Large structures that are are still collectively projecting highs for March and/or April 2022.
…
2022 starts with price dropping back from the top of a range that has become increasingly expansive since the move above 2500. With price moving back into the previously extremely volatile range above 4500 we can only assume that this expansive price action will continue – in both directions. This is a Brave New World and we should trade accordingly.
–
With much discussion going on regarding what the FED is and has been doing, I would like to recommend John Titus' fascinating in depth presentation on his youtube channel BestEvidence: Larry & Carstens' Excellent Pandemic.
–
Regardless of whether the market can move higher or whether significant lows are ahead of us, the simplicity of the proprietary price based S/T Signalling System will continue to keep us on the correct side of the market, with price currently below the Sell Signal line at 4702 since 06 January 2022.
–
In 2022, I intend to launch a Mentoring Service that will complement and expand upon the Trading the Line Subscription Service. Topics will include: T Theory, Position Trading, Day Trading, Price action, and Trading Psychology, and the intention is to provide traders with the full educational support that they may need to become successful.
If you would like to learn more about the S/T Signalling System, using T Theory or would be interested in the Mentoring Service, please get in touch.
…
To receive detailed daily analysis, guidance and the updated daily Buy / Sell trigger levels being generated by the Trading the Line system before the market opens, and intra-day alerts when appropriate, please become a Member and Sign up for Alerts & Observations – includes access to Members Area, Explanatory Notes (pdf) for all of the concepts discussed, and Notes on Day Trading (pdf)
Disclaimer: This is the diary of a personal trading system, its methodology and the signals that it is producing. You are welcome to follow along but please understand that the information presented here is for educational purposes only. No recommendations are being made to buy, or sell stocks, options or futures contracts. Please consult your own financial advisor before making any investment decisions.