
Love looks not with the eyes, but with the mind,
And therefore is winged Cupid painted blind.
Willam Shakespeare, A Midsummer Night's Dream, c.1595-96
…
Market making new all time highs hitting another important milestone, with money printing and infrastructure spending to the moon, 'tulip' manias and manipulation in 'meme' stocks, inflation in assets, commodities and apparent on main street…
Buy Signal continues.
Save the image to your desktop to view a larger version
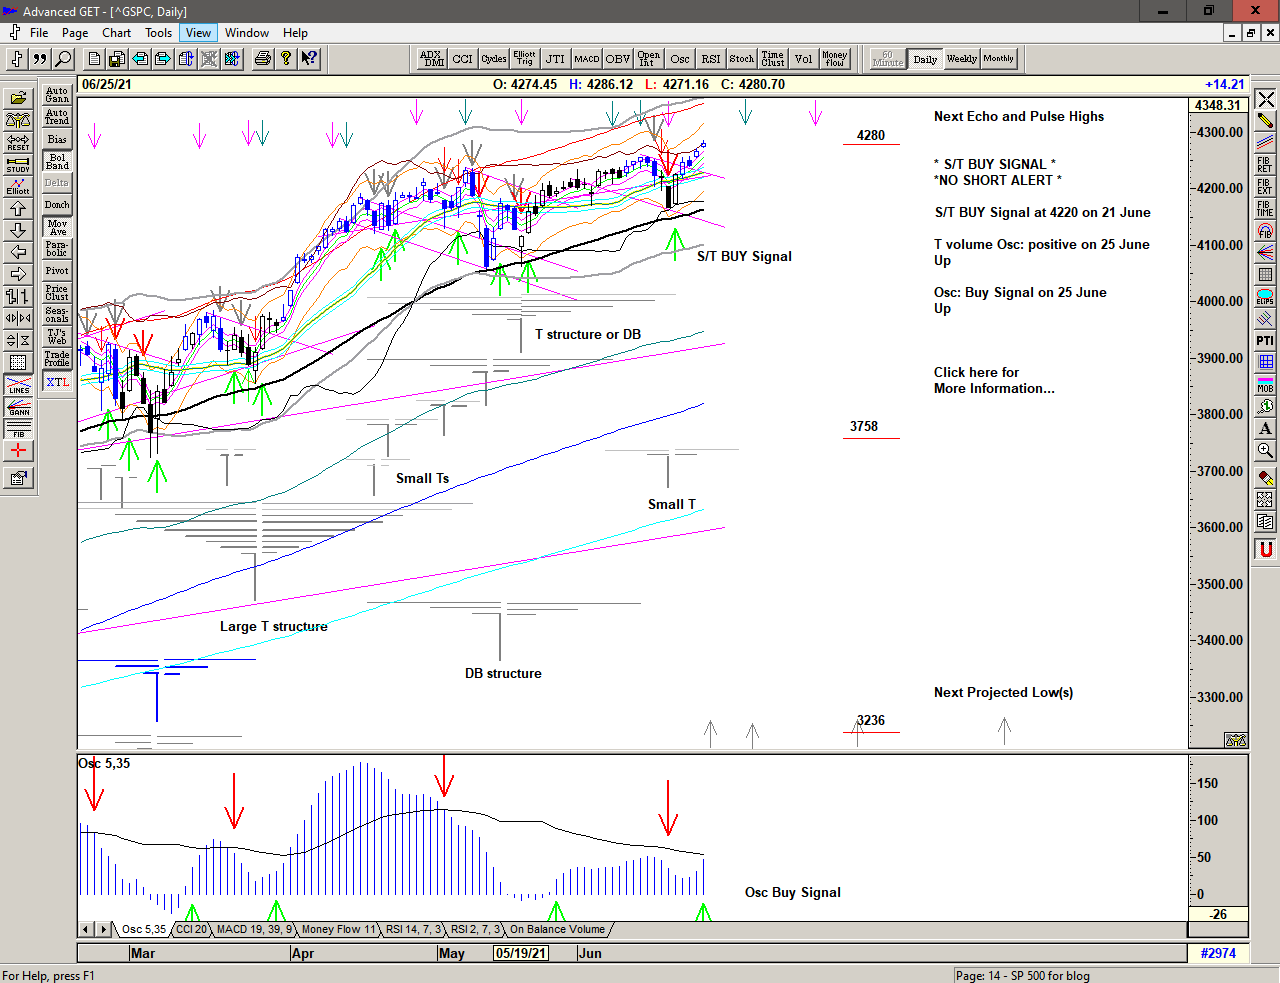
A couple of months of range trading since the high in mid April, mostly pushing at 4200 but with a few quick and nasty drops, back filling but holding above the psychologically important 4000 level. Building an upper range.
Most recently a Buy Signal at 4220 after a brief 'taper tantrum' and a straight up move into new all time highs and reaching the key level of 4280 at the end of the second quarter.
Save the image to your desktop to view a larger version
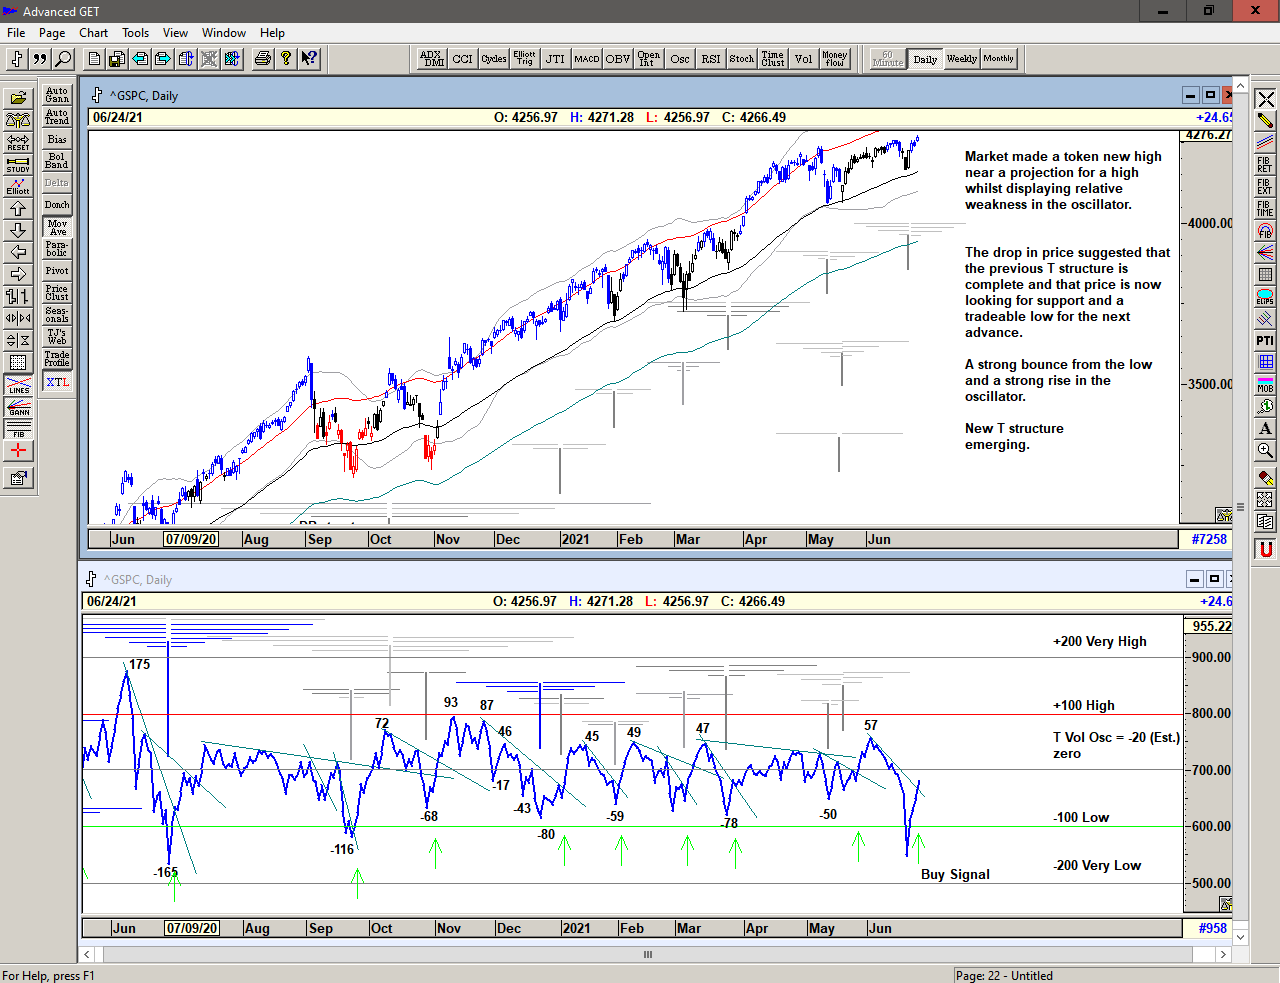
The T volume oscillator 1 shows the deterioration in buying power that was occurring from about 08 June whilst the market was moving into the projection for a high from the previous structures and notably from the recent DB (Double bottom) structure.
However, the subsequent rapid recovery from the selling on 18 June has now triggered a new oscillator Buy Signal with a strong rise up through the declining cash build up line 2 and this now projects strength into 06-07 July from the previous oscillator high.
1 The T volume oscillator is an indication of Buying Power within the market as a whole
2 The cash build-up line is a declining line drawn above a series of lower highs made in the oscillator.
Save the image to your desktop to view a larger version
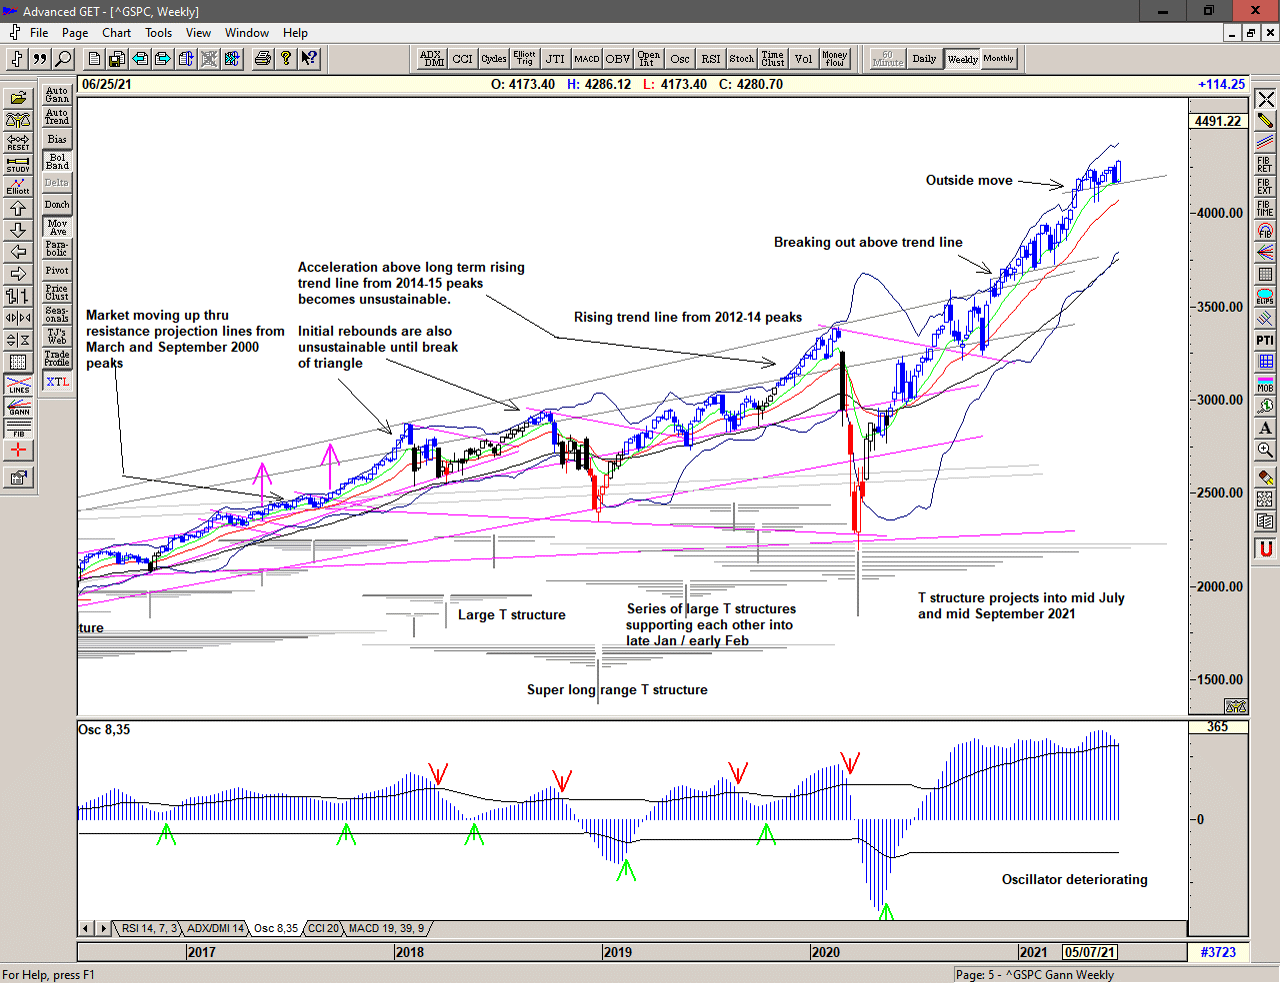
In the weekly chart above, we can see that price continues to be strong, finding support at last week's low. The oscillator is however, declining and this is flashing a warning that this move may not be sustainable. The large structure, centered at the March 2020 low projects strength into Mid July and possibly into Mid September.
For now, the 4160 level is important support.
Save the image to your desktop to view a larger version
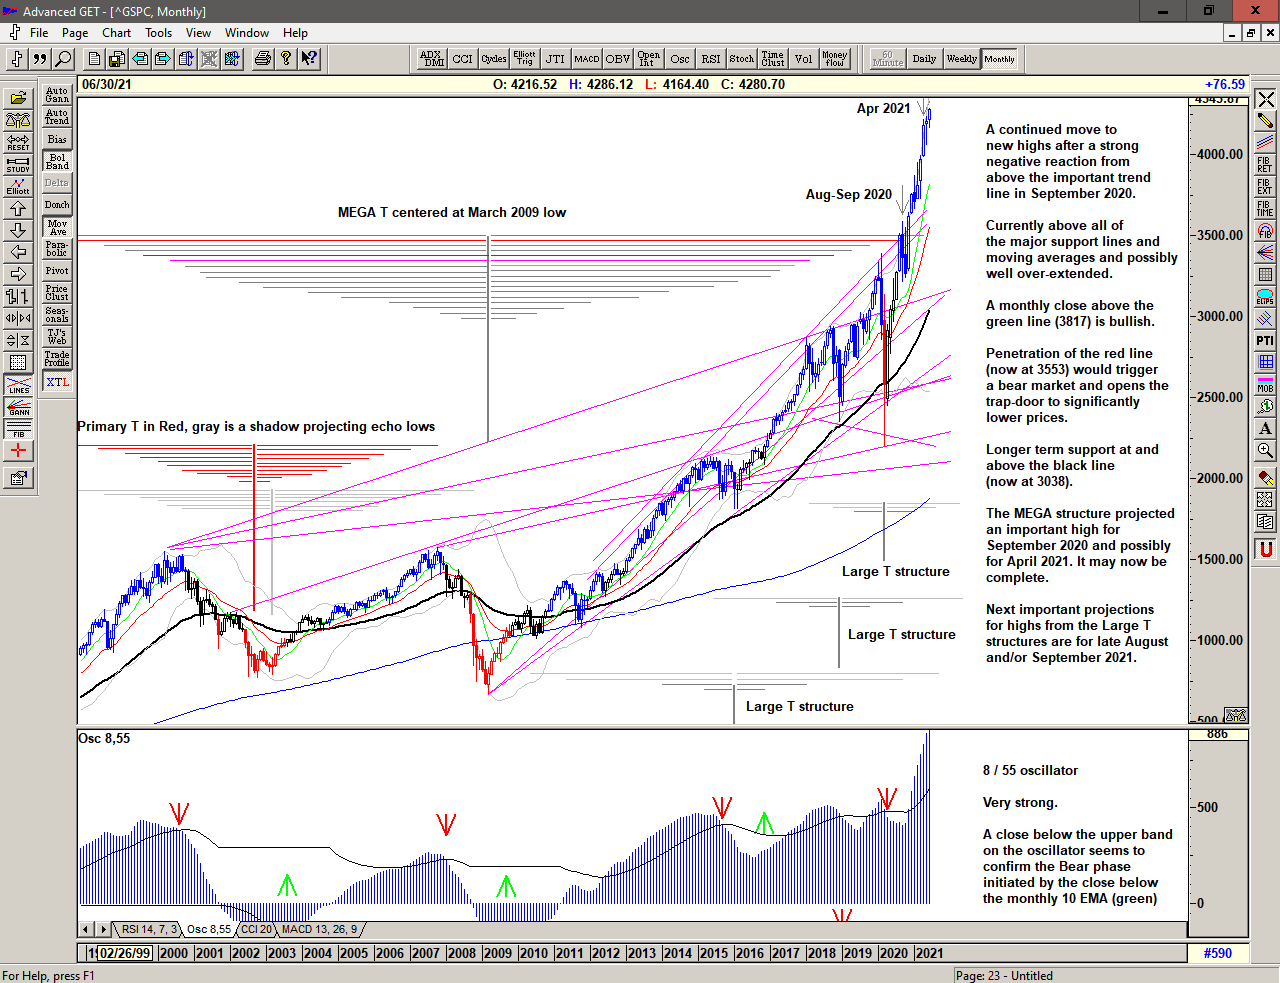
The monthly chart continues to look excessive but the market continues higher beyond the projection for a major high from the Mega T structure, which may have completed in September 2020.
The current large structures project highs for August and/or for September 2021 and possibly longer into April 2022.
…
2021 continues with a range that has become increasingly expansive since the move above 2500. With price above 4000 we can only assume that this will continue. This is a Brave New World.
–
Regardless of whether the market can continue higher or whether significant lows are ahead of us, the simplicity of the proprietary price based S/T Signalling System will continue to keep us on the correct side of the market, with price currently on a Buy Signal since moving above 4220 on 21 June 2021.
If you would like to learn more about using the S/T Signalling System please get in touch.
–
Be prepared for what is coming next and trade with confidence:
To receive detailed daily analysis, guidance and the updated daily Buy / Sell trigger levels being generated by the Trading the Line system before the market opens, and intraday alerts when appropriate, please become a Member and Sign up for Alerts & Observations – includes access to Members Area and the 'Explanatory Notes' for all of the concepts discussed as well as the new 'Notes on Daytrading' which provides insight into how to look for shorter term entries and exits within the context of the S/T Signalling System.