
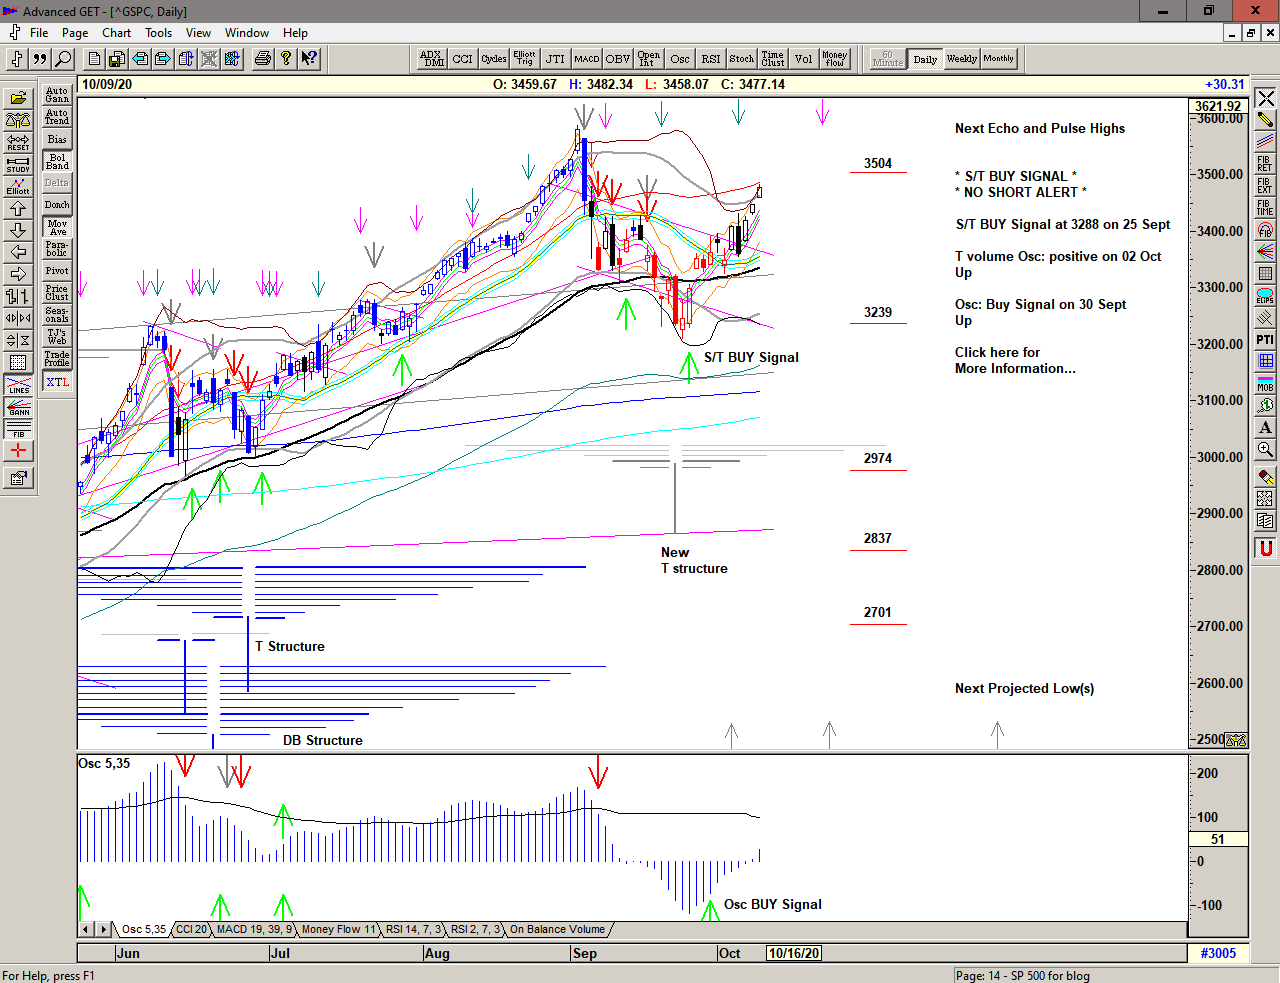
A harsh sell-down from the late August high, back down to the late July lows at 3210 before the current S/T Buy Signal on 25 September at 3288.
Market gaps, chops and grinds higher on its way back up towards the all time high with a new T structure emerging from the late September low and the potential of more highs ahead.
Save the image to your desktop to view a larger version
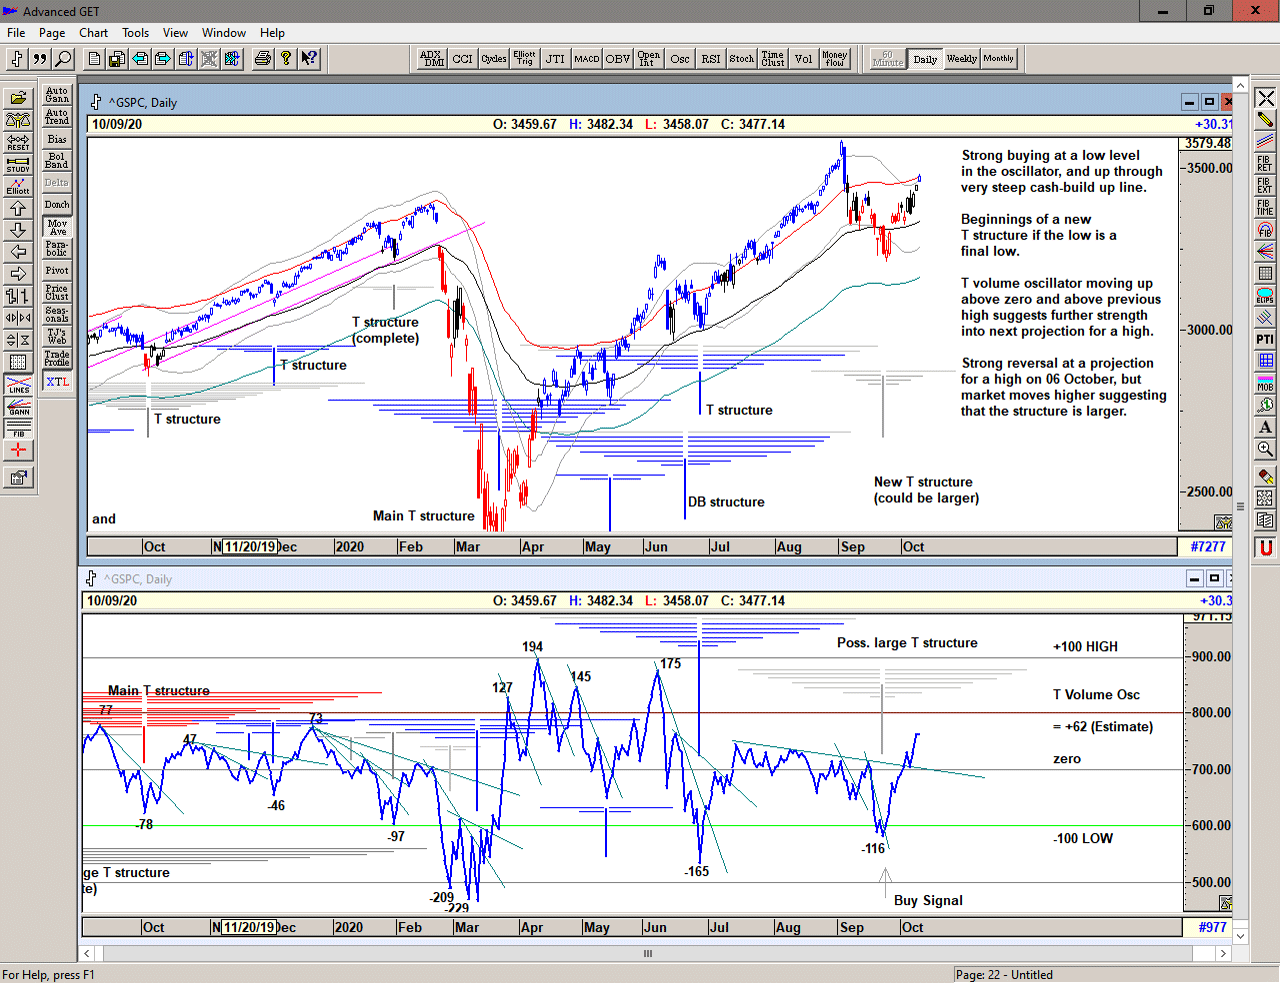
The T volume oscillator* has been rising since making the September low rising firstly above the steep cash build up line** on 25 September and subsequently also above the longer shallow cash build up line** on 05 and 07 September.
A movement upward through the cash build up line activates the T structure and draws buying power from each of the previous declines. Each previous high in the oscillator and in price projects a new potential high until the buying is exhausted.
Currently the market is moving into the primary projection from the all time high and likely will encounter some resistance in price, but with the oscillator still rising it is also likely that the market moves into a phase of marking out a new range with profit-taking, buying the dip and re-cycling until price reaches its target and becomes exhausted.
* The T volume oscillator is an indication of Buying Power within the market as a whole
** The cash build-up line is a declining line drawn above a series of lower highs made in the oscillator.
Save the image to your desktop to view a larger version
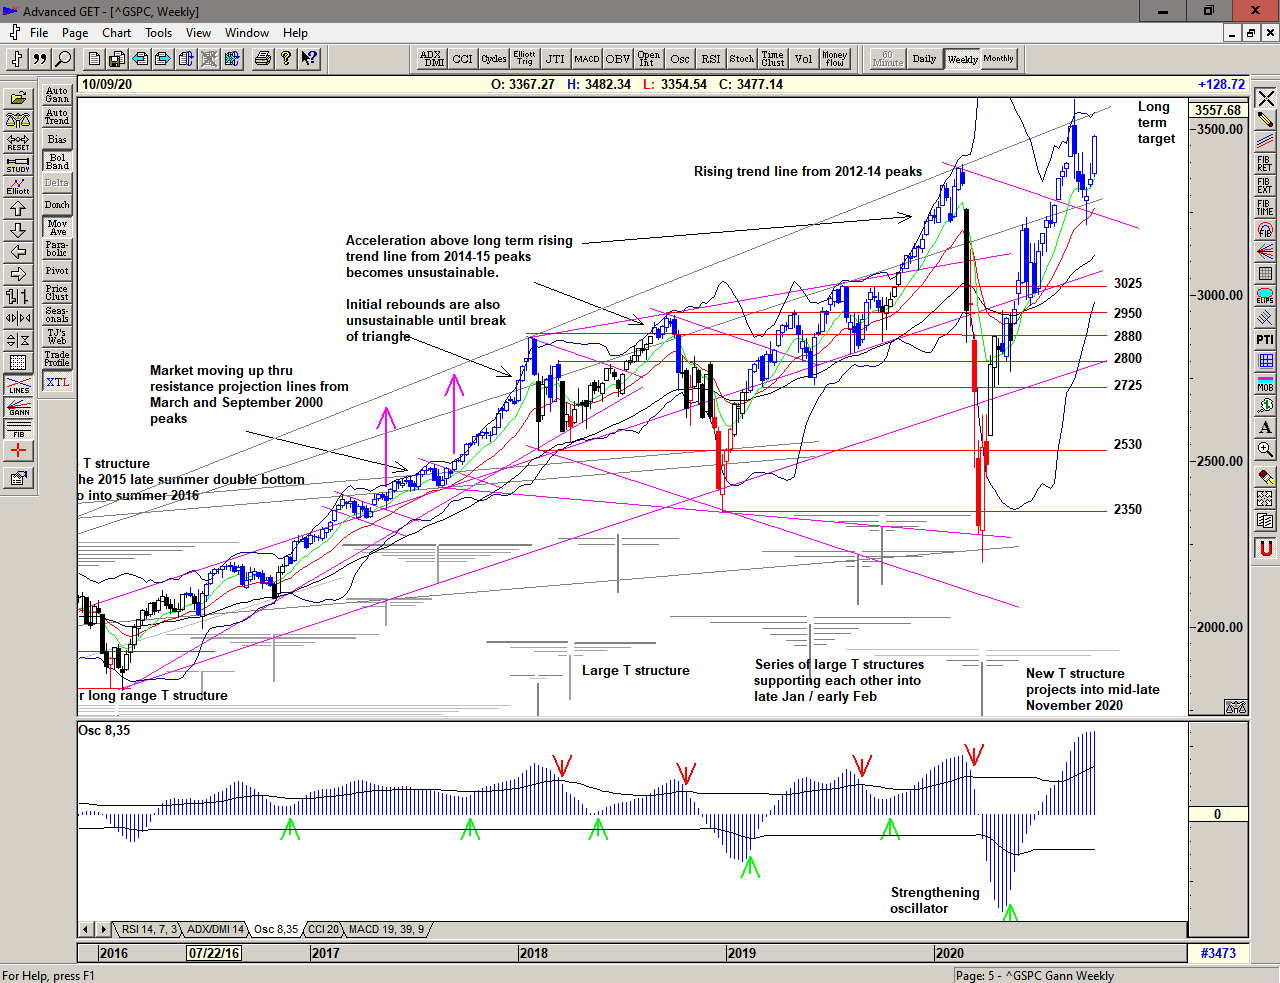
Zooming out to the weekly chart, we can see that price is moving back towards the sharp reversal at the all time high and the rising trend line from the 2012-14 peaks.
That upper trendline has triggered major price reversals and should therefore be treated with extreme caution once reached.
The large T structure centered on the March low projects the next major high in the week of November 20 – a post Election high?
Save the image to your desktop to view a larger version
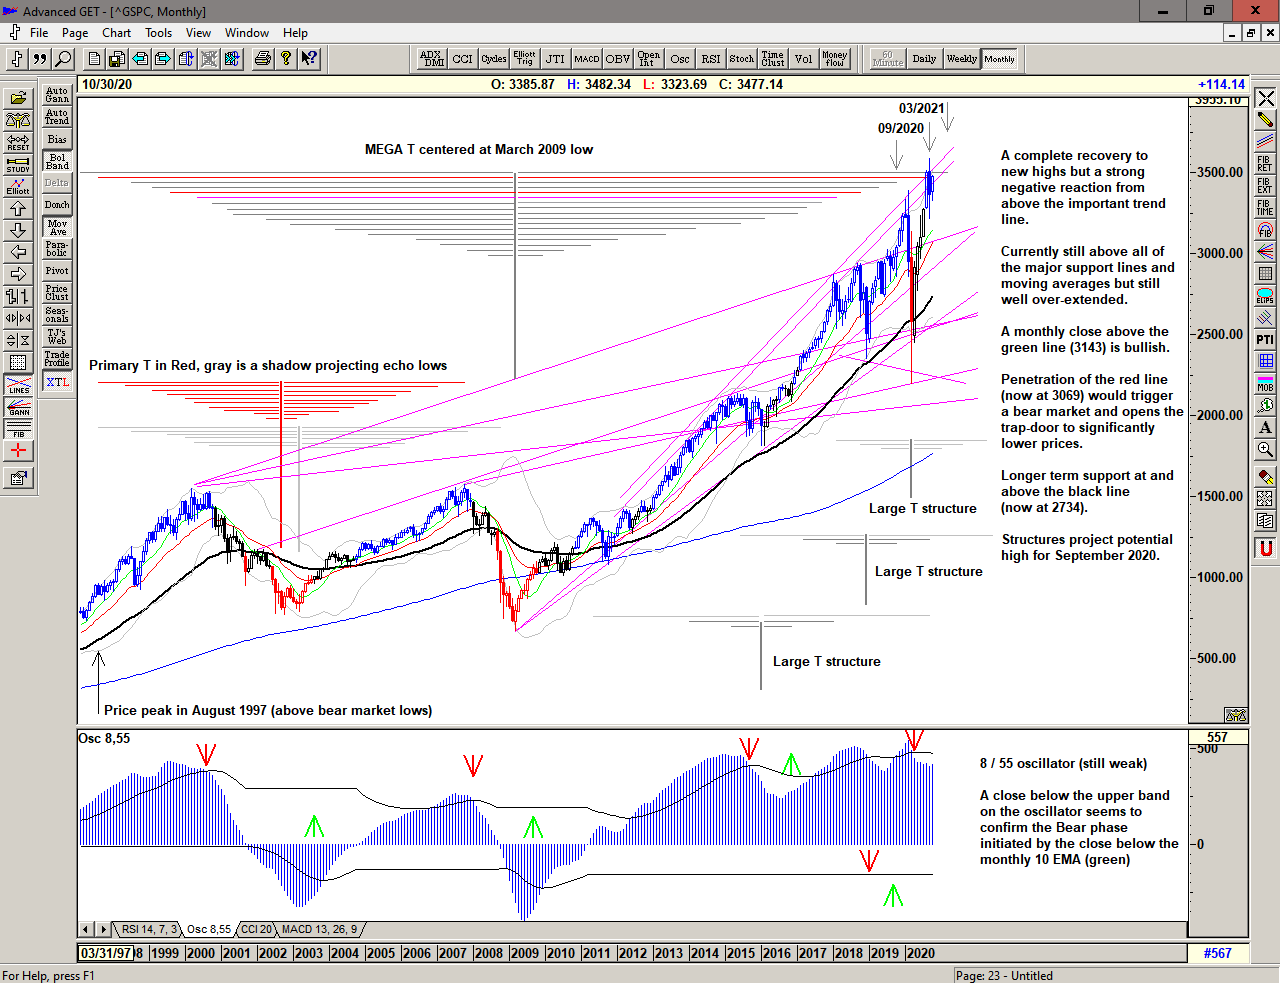
The monthly chart shows the rapid reversal from above the long term trendlines at the projection for an important high in September 2020. Currently the market appears to be heading back for at least a re-test of that high with possible highs projected for January 2021 and for March 2021.
The long term oscillator although weakened by the collapse looks like it is strengthening again.
Save the image to your desktop to view a larger version
2020 is bringing some fast and furious action in the market with a range that became increasingly expansive since the move above 2500 in the Fall of 17. We can only assume that this will continue. This is a Brave New World.
–
Regardless of whether the market can continue higher or whether significant lows are ahead of us, the simplicity of the proprietary price based S/T Signalling System will continue to keep us on the correct side of the market, with price currently on a Buy Signal since moving above 3288 on 25 September 2020.
If you would like to learn more about using the S/T Signalling System please get in touch.
–
To receive detailed daily analysis, guidance and the updated daily Buy / Sell trigger levels being generated by the Trading the Line system before the market opens, and intra-day alerts when appropriate, please become a Member and Sign up for Alerts & Observations – includes access to Members Area, Explanatory Notes (pdf) for all of the concepts discussed, and Notes on Day Trading (pdf)
Disclaimer: This is the diary of a personal trading system, its methodology and the signals that it is producing. You are welcome to follow along but please understand that the information presented here is for educational purposes only. No recommendations are being made to buy, or sell stocks, options or futures contracts. Please consult your own financial advisor before making any investment decisions.