
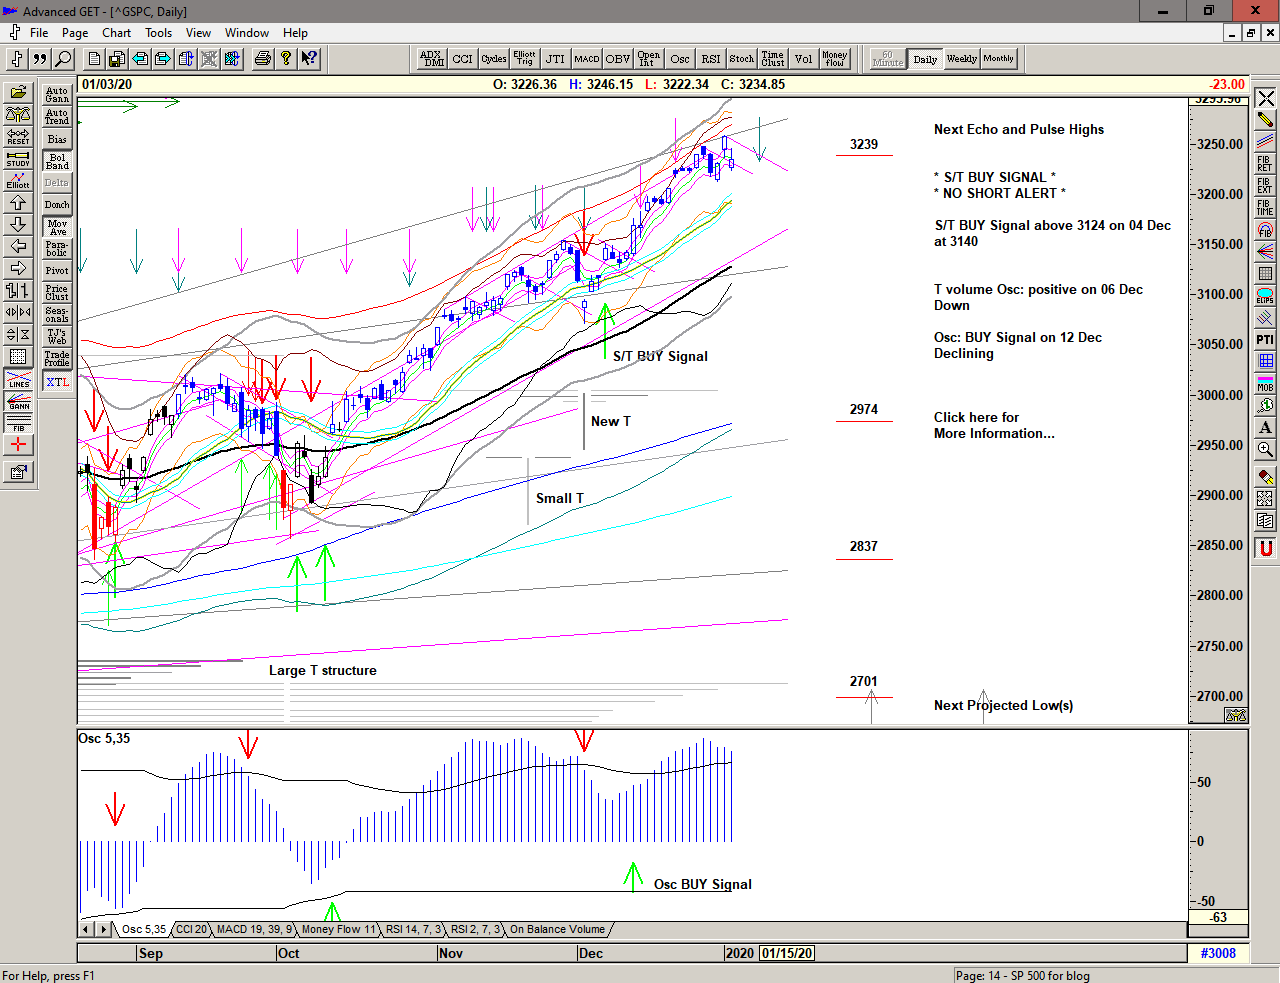
A new decade finds the S&P's trading at significantly higher prices since the 'breakout' up through the previous strong resistance at 3021 with a relatively calm straight up pop and grind higher into 3250 by end of year.
The majority of the Fall advance has been just 2 Buy Signals, firstly on 10 October triggered at 2929 and then on 06 December triggered above 3124 after the very brief drop on 03 December. Although challenged last week, this signal is currently still active with price continuing to make new highs and holding up above the Buy Signal line, for now.
With the market displaying such impressive strength throughout the last quarter the question arises:
Is there more upside and what is the potential for collapse?
Firstly, price has achieved some important levels including the 2019 R2 pivot at 3192 in mid December and reached the upper extreme of the channel * when it touched 3248 for the first time on 27 December. That in of itself is a rare occurrence and the last occasions were during late February 2019.
Secondly, the large T structure centered at the October low and the more recent T structure centered on the December low look to achieved their target projections, in which case it would be usual to expect some kind of consolidation or price decline prior to the next advance.
Thirdly, the market has made repeated warnings of complacency via the Put/Call ratios throughout the advance.
* The upper extreme of the channel is my approximation of the energy channel discussed by Terry Laundry.
Save the image to your desktop to view a larger version
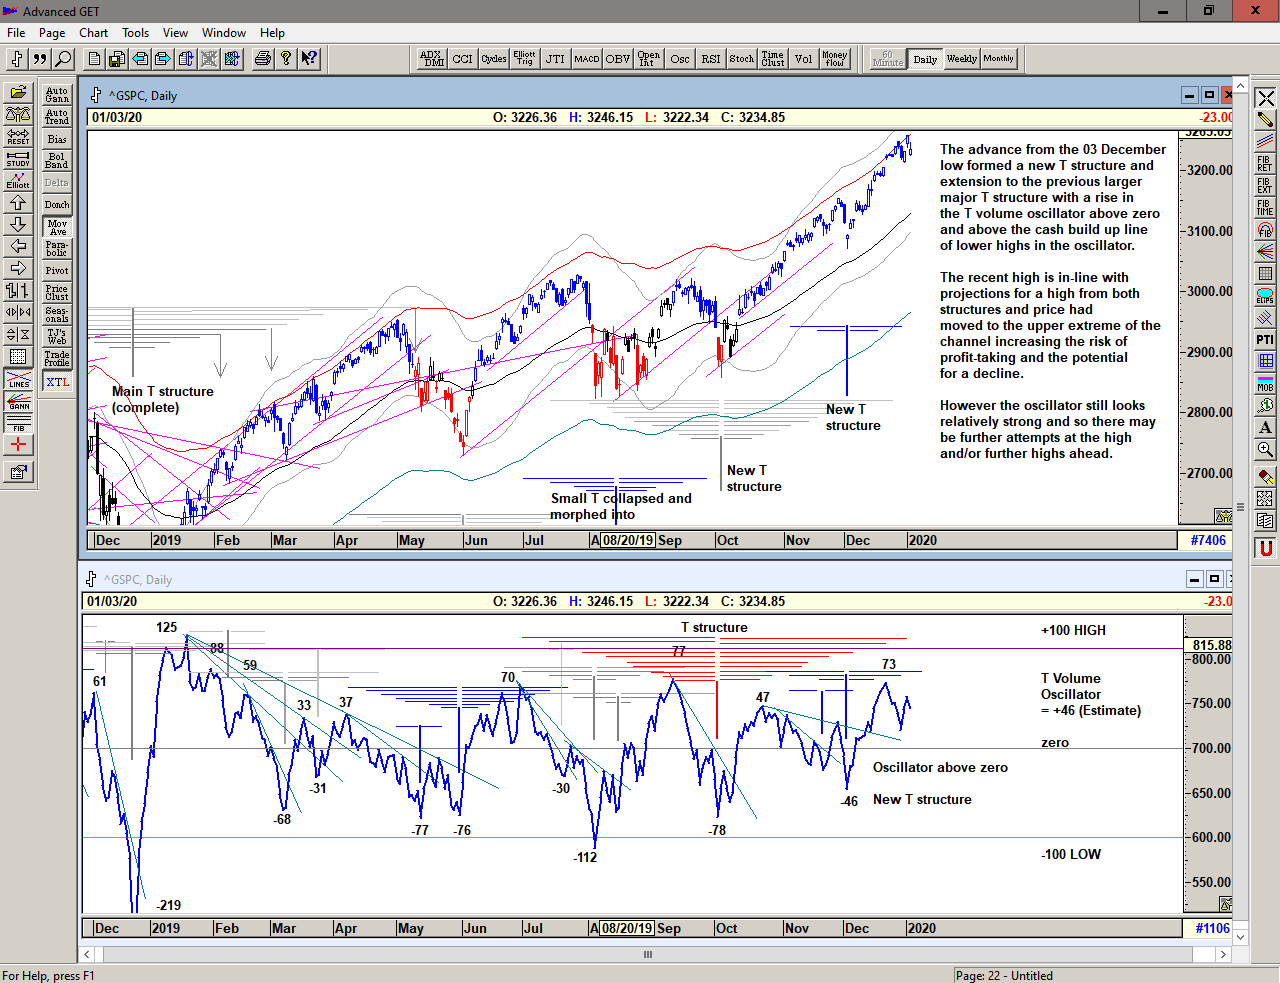
As we can see in the chart below with the T volume oscillator**, each of the 2 recent Buy Signals were accompanied by a strong rise in the oscillator up through the declining cash build-up line*** confirming the presence of new T structures,
Once the oscillator makes a high and starts to decline, this indicates profit-taking and re-cycling. A rapid drop and a movement below zero is a warning especially if the price continues to rise as it indicates a reduction in buying power.
For now, the oscillator continues to look strong suggesting that although at projections for highs from the recent structures, there is still the potential for further highs ahead.
** The T volume oscillator is an indication of Buying Power within the market as a whole
*** The cash build-up line is a declining line drawn above a series of lower highs made in the oscillator.
Save the image to your desktop to view a larger version
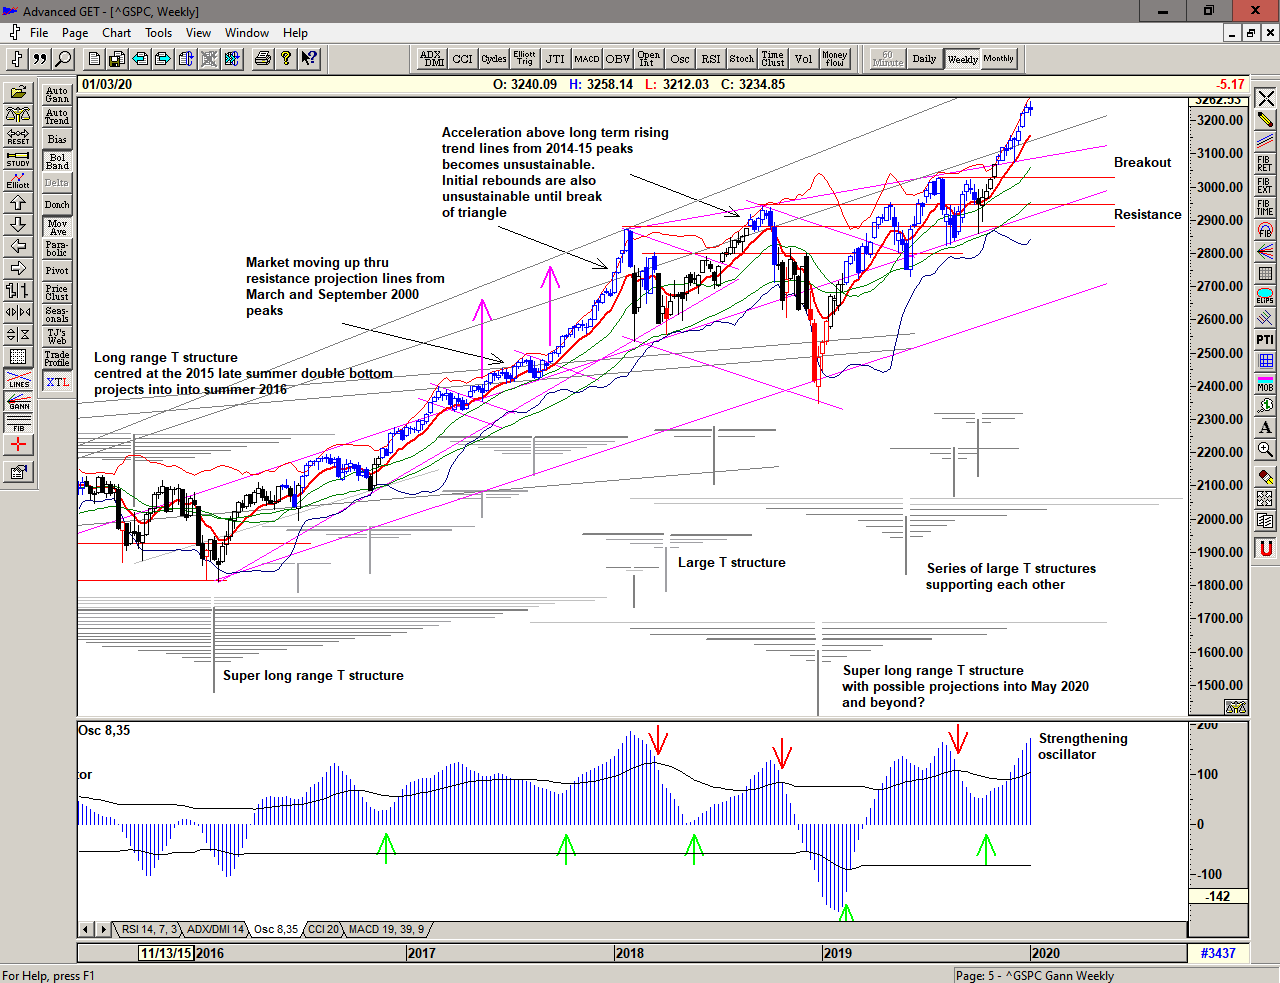
The weekly chart shows that price (since moving above 3100) is back above the trendline that initiated the 2018 collapses suggesting some caution.
However, note that when price broke out strongly above 2500 it continued higher until rejected by the steeper long term trendline, currently somewhere near 3500 – perhaps a longer term target?
The weekly T structures continue to overlap and combine – this has presumably provided the additional fuel for the breakout. Some caution is warranted as the most recent structures projected highs in December and this move may be complete or close to completion. The earlier structures may still be projecting highs in late January and May respectively.
The oscillator continues to look strong since the October low.
Save the image to your desktop to view a larger version
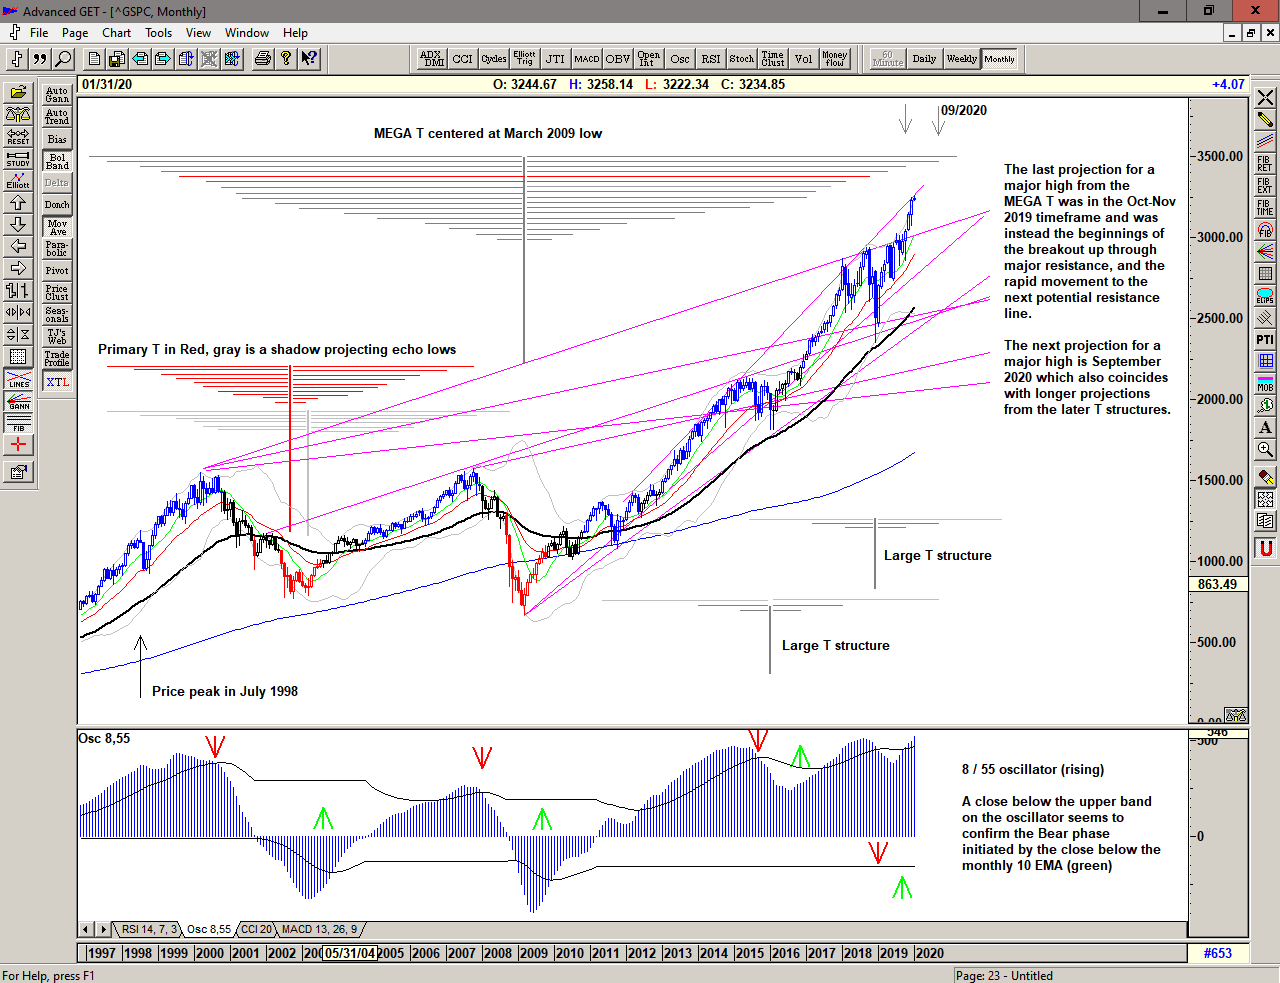
The monthly chart shows the important trendline projected from the 2000 peak and the rapid move above it once it was effectively breached leading directly to the steeper trend-line from the 2016 highs.
The Mega T structure projected another important high for October or November which instead developed into the breakout. The next major projection is for a high in September 2020 which is also in-line with projections from the more recent large long term structures.
The long term oscillator remains very strong supporting the breakaway move higher.
Some kind of consolidation and even a nasty pullback like we saw in 2016 and early 2018 may be necessary to relieve some of the upward pressure and complacency and allow price to catch up with itself, but if price can continue to hug the trendline we could see a continued move higher into a (more) significant peak.
A major reversal at this level could bring the breakout trendline back into focus and the building of new high level support, perhaps similar to what we saw in 2015-16 or 2018.
Save the image to your desktop to view a larger version
2020 will most likely bring some fast and furious action in the market with a range that continues to be expansive, especially since the move above 2500. With price above 3000 we can only assume that this will continue. This is a Brave New World.
–
Regardless of whether the market can continue higher or whether significant lows are ahead of us, the simplicity of the proprietary price based S/T Signalling System will continue to keep us on the correct side of the market, with price currently on a Buy Signal since 3140 on 06 December 2019.
If you would like to learn more about using the S/T Signalling System please get in touch.
–
Be prepared for what is coming next and trade with confidence:
To receive detailed daily analysis, guidance and the updated daily Buy / Sell trigger levels being generated by the Trading the Line system before the market opens, and intraday alerts when appropriate, please become a Member and Sign up for Alerts & Observations – includes access to Members Area and the 'Explanatory Notes' for all of the concepts discussed as well as the new 'Notes on Daytrading' which provides insight into how to look for shorter term entries and exits within the context of the S/T Signalling System.
If you do not want to receive any more reports, please use the 'Unsubscribe' link below.