
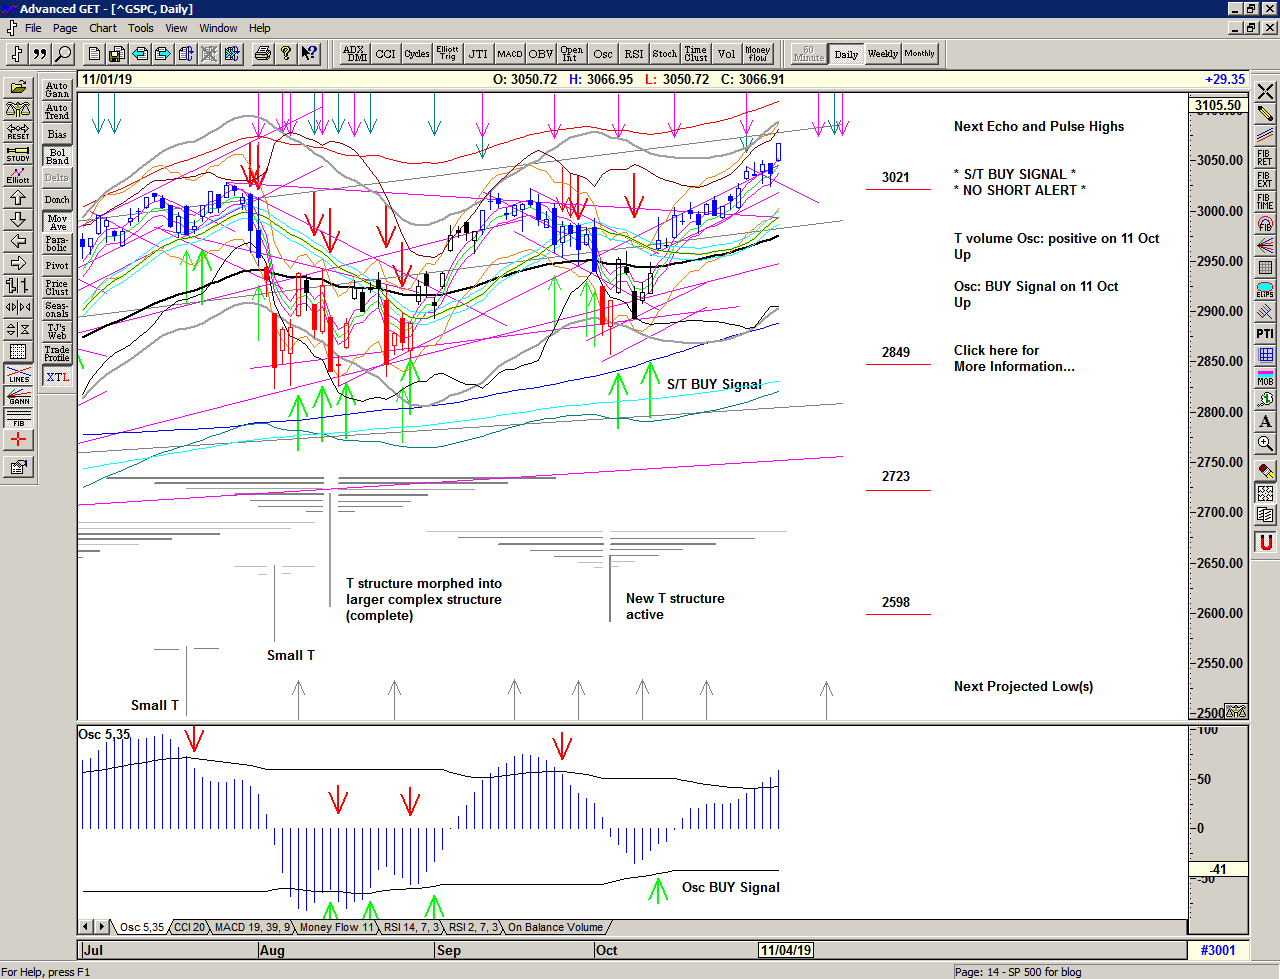
A very choppy end to September and a quick look lower is met with strong buying below 2900 and an October push back up into 3000. Some initial hesitation at 3000 – the previous sell zone – is met with strong buying and a push up through the 3021 pivot to new all time highs.
It has been noticeable that on each of the recent negative and volatile phases that the market has been met with days of very strong supportative buying, ultimately leading to new attempts at the previous high.
Back at new all time highs and at a projection for a high from the current T structure and an active Buy Signal since 10 October.
More of the same, or something different?
Save the image to your desktop to view a larger version
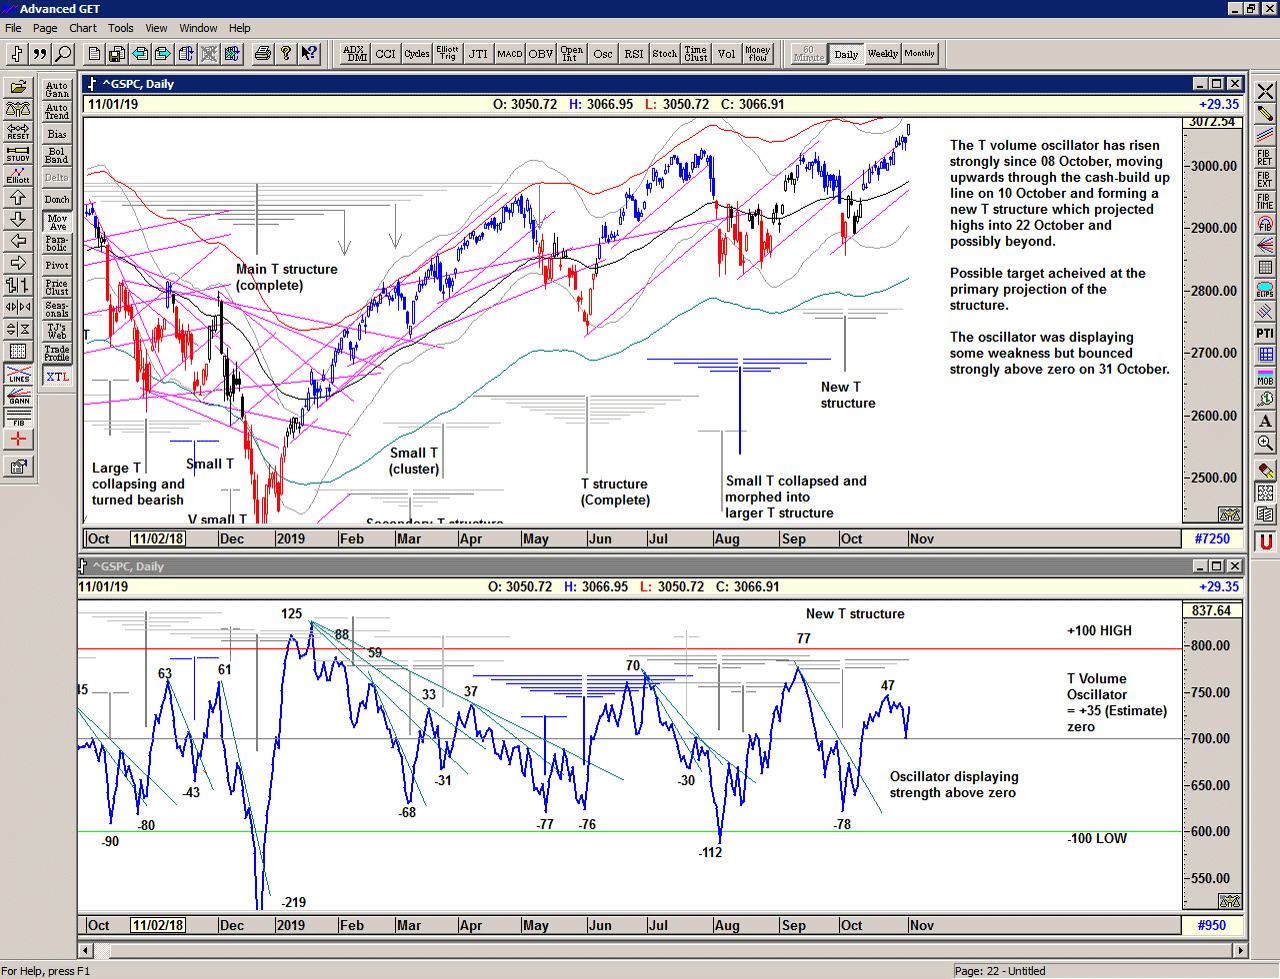
As we can see in the chart below with the T volume oscillator*, the recent Buy Signal was accompanied by a rise in the oscillator up through the declining cash-build up line confirming the prescence of a new T structure with projections into 22 and 28 October and possibly early November.
Of course this could be the end of the move, but if there is more, then we are starting to see the power of the previous structures combine and boost the market in what may be some kind of crescendo or breakaway move.
* The T volume oscillator is an indication of Buying Power within the market as a whole
Save the image to your desktop to view a larger version
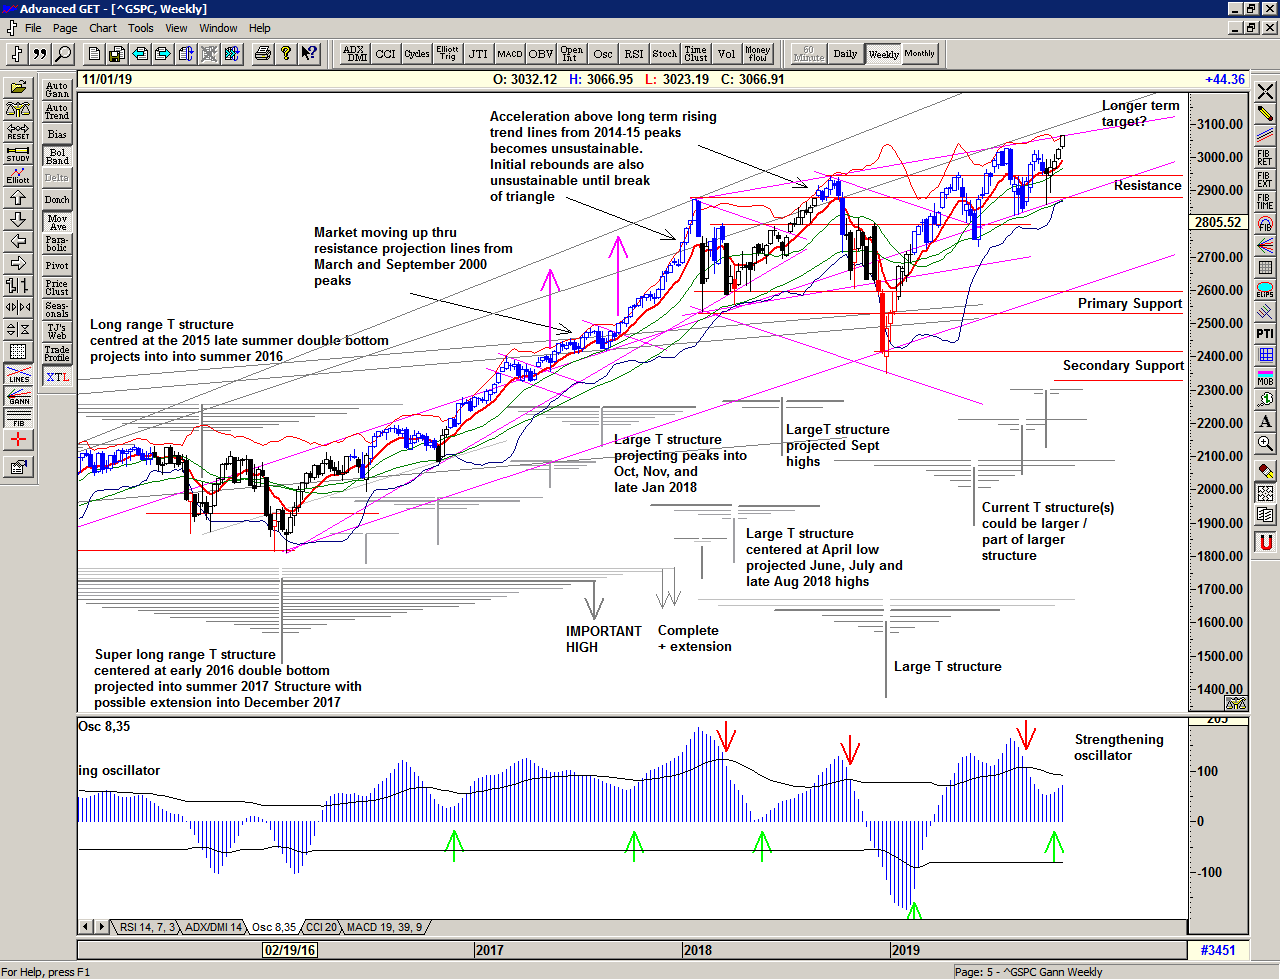
The weekly chart continues to show a bullish market within the context of the long term trajectory having found support at the long term rising angle (again) and with price now moving up into the trend line resistance from the previous highs.
The oscillator has now recovered with the quick look lower and resumed a strengthening position.
The weekly T structures show the potential for the overlapping and combining of the structures into November and/or even December highs, in-line with the possibility that the market is making a breakaway move above 3000.
If that is the case then we may be in for a move similar to that initiated in September 2017 when the market unexpectantly broke through important numerical resistance.
Save the image to your desktop to view a larger version
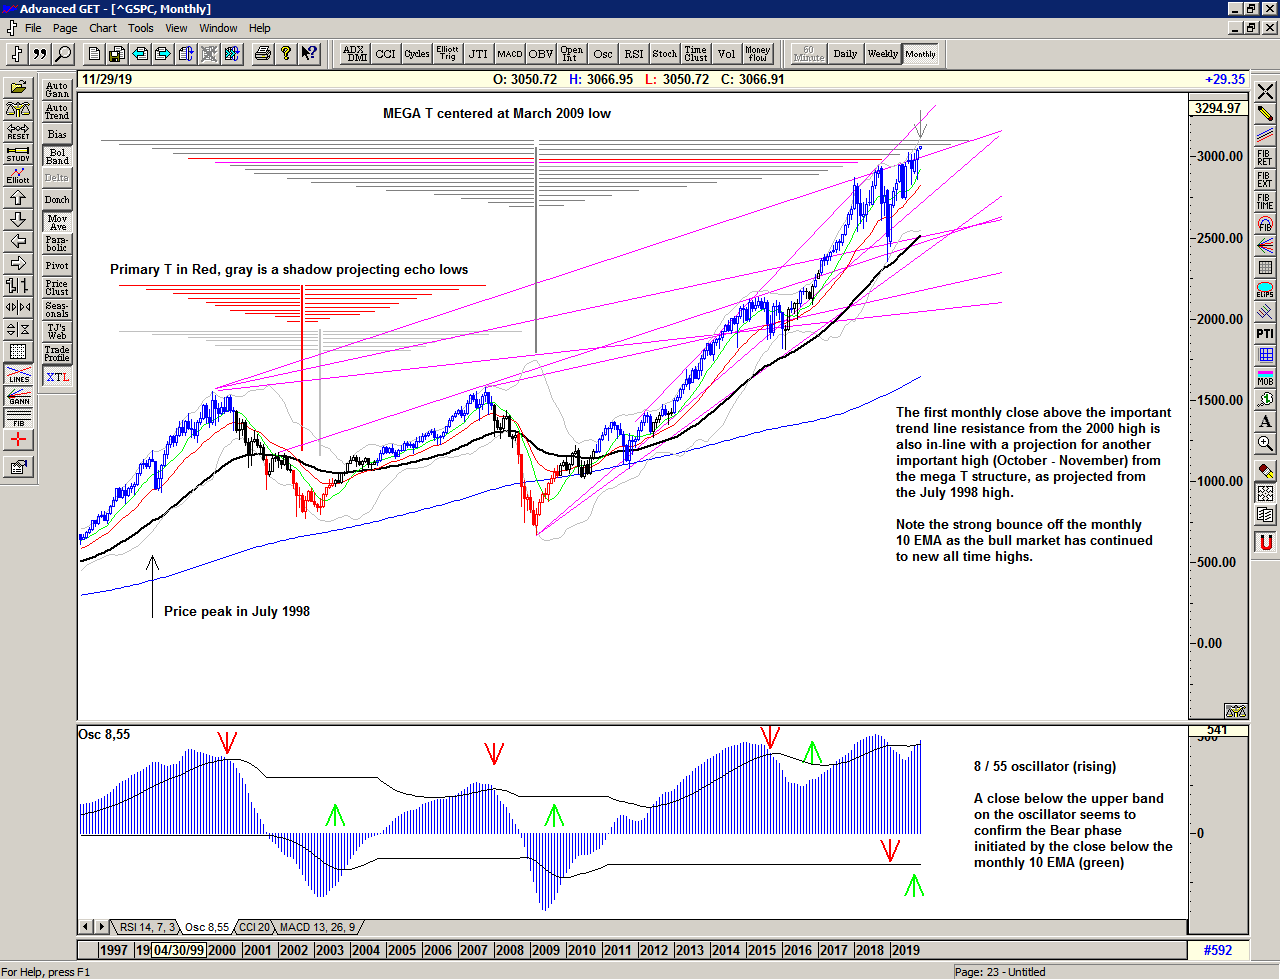
The monthly chart shows the important trendline projected from the 2000 peak and the first monthly close above it.
The Mega T structure projects another important high for October or November, and the oscillator remains strong supporting the possibility of a breakaway move higher.
Some kind of spike high above here and/or a monthly close back below the trendline would be a danger sign but for now the long term oscillator looks very strong and more like it was back in 2017.
Save the image to your desktop to view a larger version
2019 continues to bring some fast and furious action in the market with a range that continues to be expansive. We can only assume that this will continue. This is a Brave New World.
–
Regardless of whether the market can continue higher or whether significant lows are ahead of us, the simplicity of the proprietary price based S/T Signalling System continues to keep us on the correct side of the market, with price currently on a Buy Signal since 2929 on 10 October 2019
If you would like to learn more about using the S/T Signalling System please get in touch.
–
Be prepared for what is coming next and trade with confidence:
To receive detailed daily analysis, guidance and the updated daily Buy / Sell trigger levels being generated by the Trading the Line system before the market opens, and intraday alerts when appropriate, please become a Member and Sign up for Alerts & Observations – includes access to Members Area and the ‘Explanatory Notes’ for all of the concepts discussed as well as the new ‘Notes on Daytrading’ which provides insight into how to look for shorter term entries and exits within the context of the S/T Signalling System.