
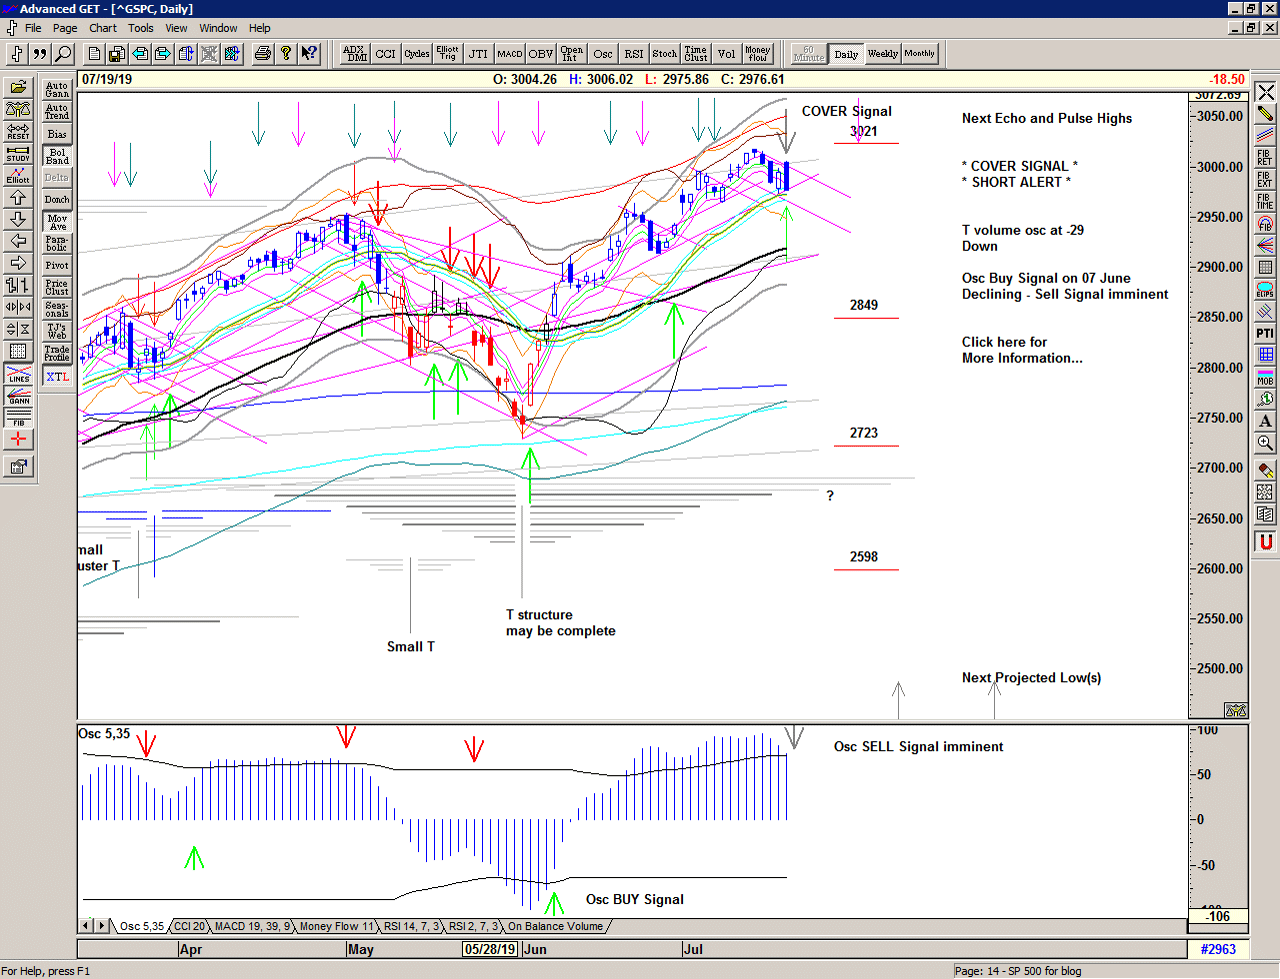
A Buy Signal on 28 June sees the market push into an Independence Day high at 2995 and subsequently a few days above 3000 before pulling back last week and confirming the high with a quick re-visit on 19 July.
And so the market is back at a neutral place, with a Cover Signal, at recent price support and looking somewhat vulnerable as much further weakness will likely trigger a Sell Signal.
Save the image to your desktop to view a larger version
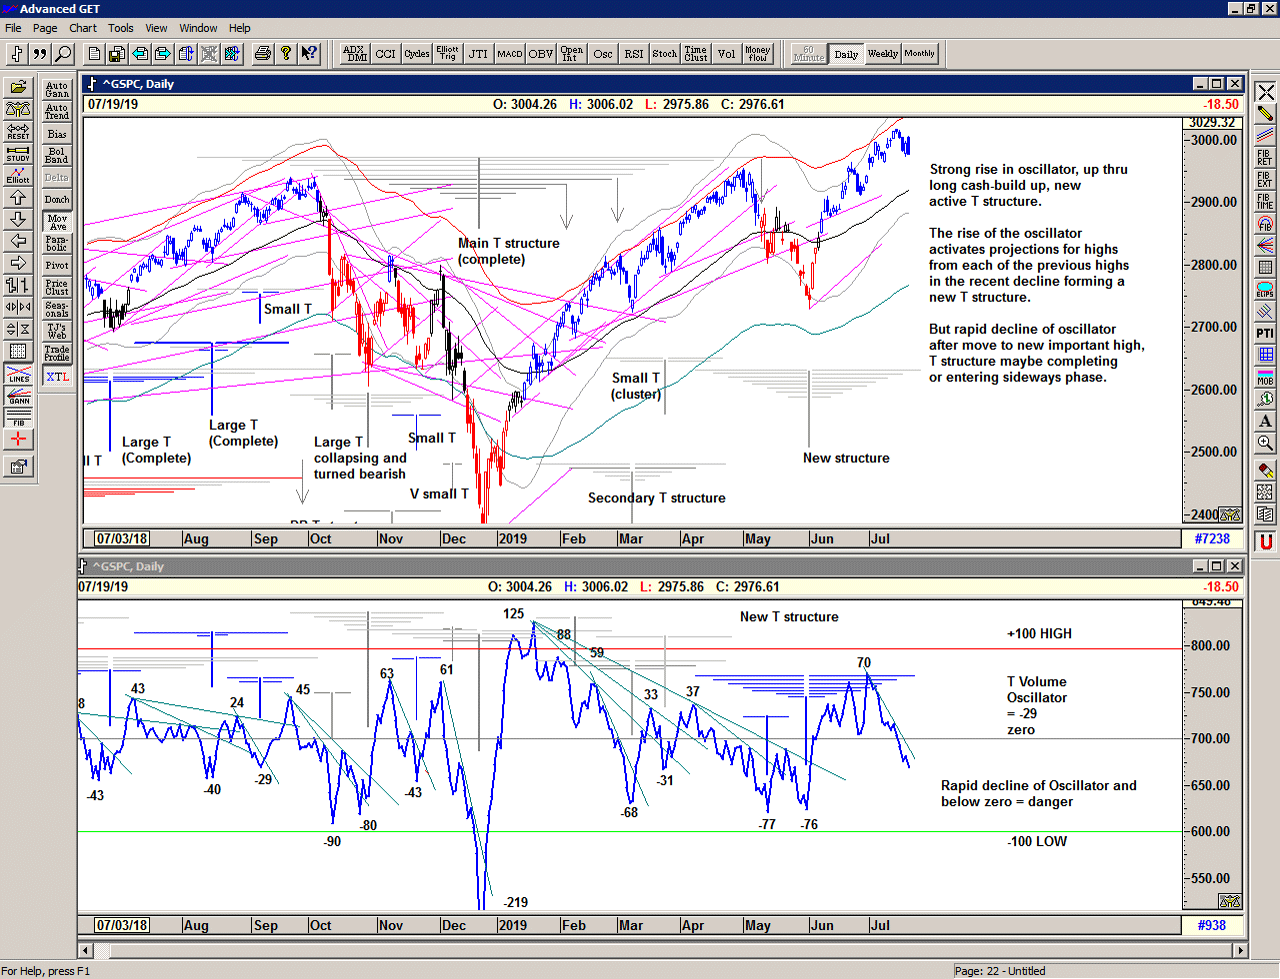
As we can see in the chart below with the T volume oscillator*, the oscillator has been generally in decline since the surge into Independence day, therefore displaying a tendency towards profit-taking and distribution at the subsequent high. As you can see, a declining oscillator, especially below the zero level, is an indication of weakness.
We now want to see the oscillator start to move upwards through the declining cash build up line of lower highs in the oscilllator to indicate that a new advance is underway. This is often accompanied with a w shaped pattern and price makes a lower low whilst the oscillator does not.
* The T volume oscillator is an indication of Buying Power within the market as a whole
Save the image to your desktop to view a larger version
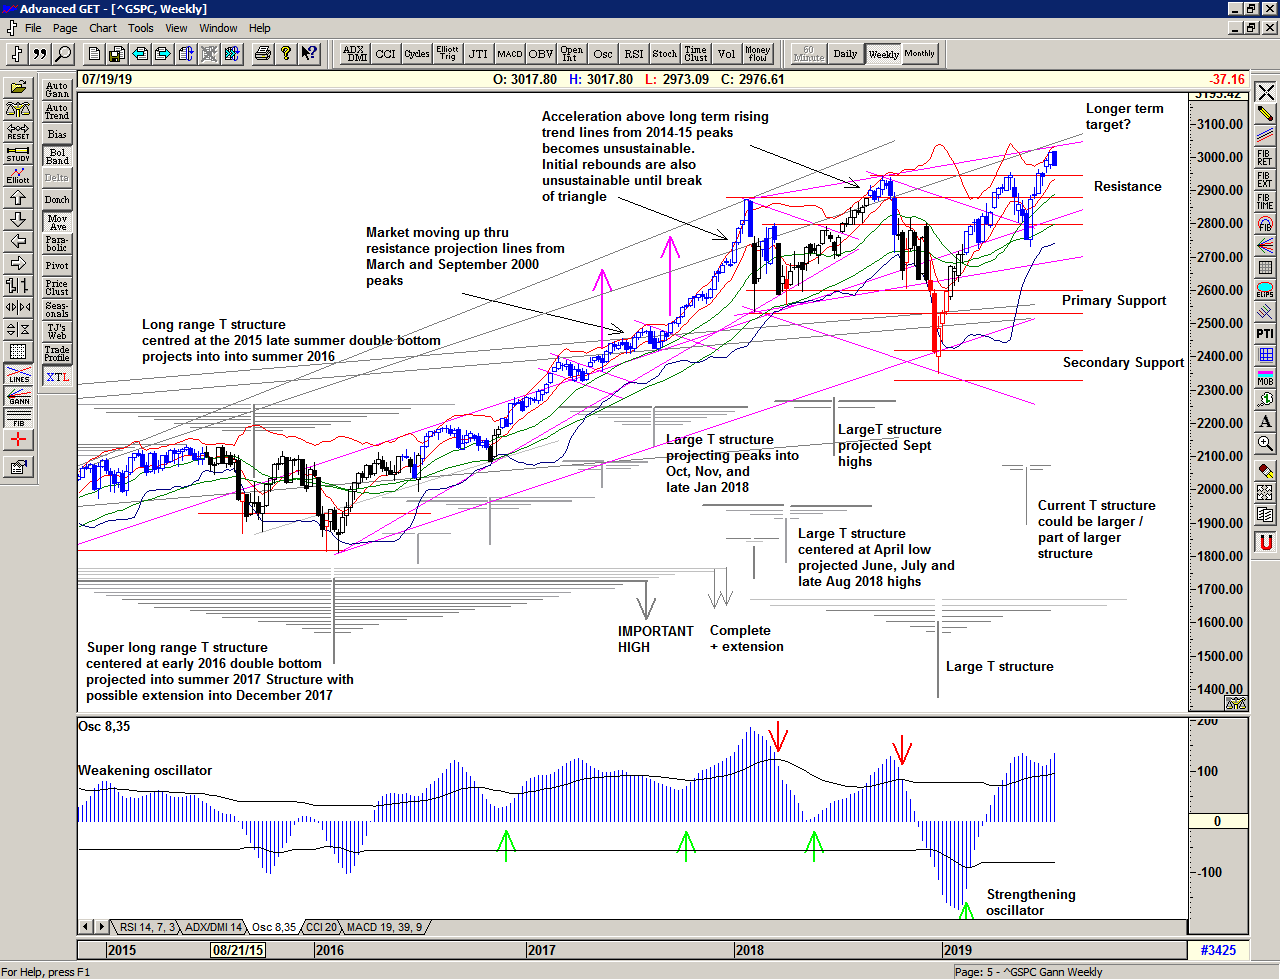
In the weekly chart below we can see that the recent high was fairly close to potential longer term target resistance and looking relatively strong since the early June bounce, but also at a projection for a high from the larger T structure centered at the December low.
Save the image to your desktop to view a larger version
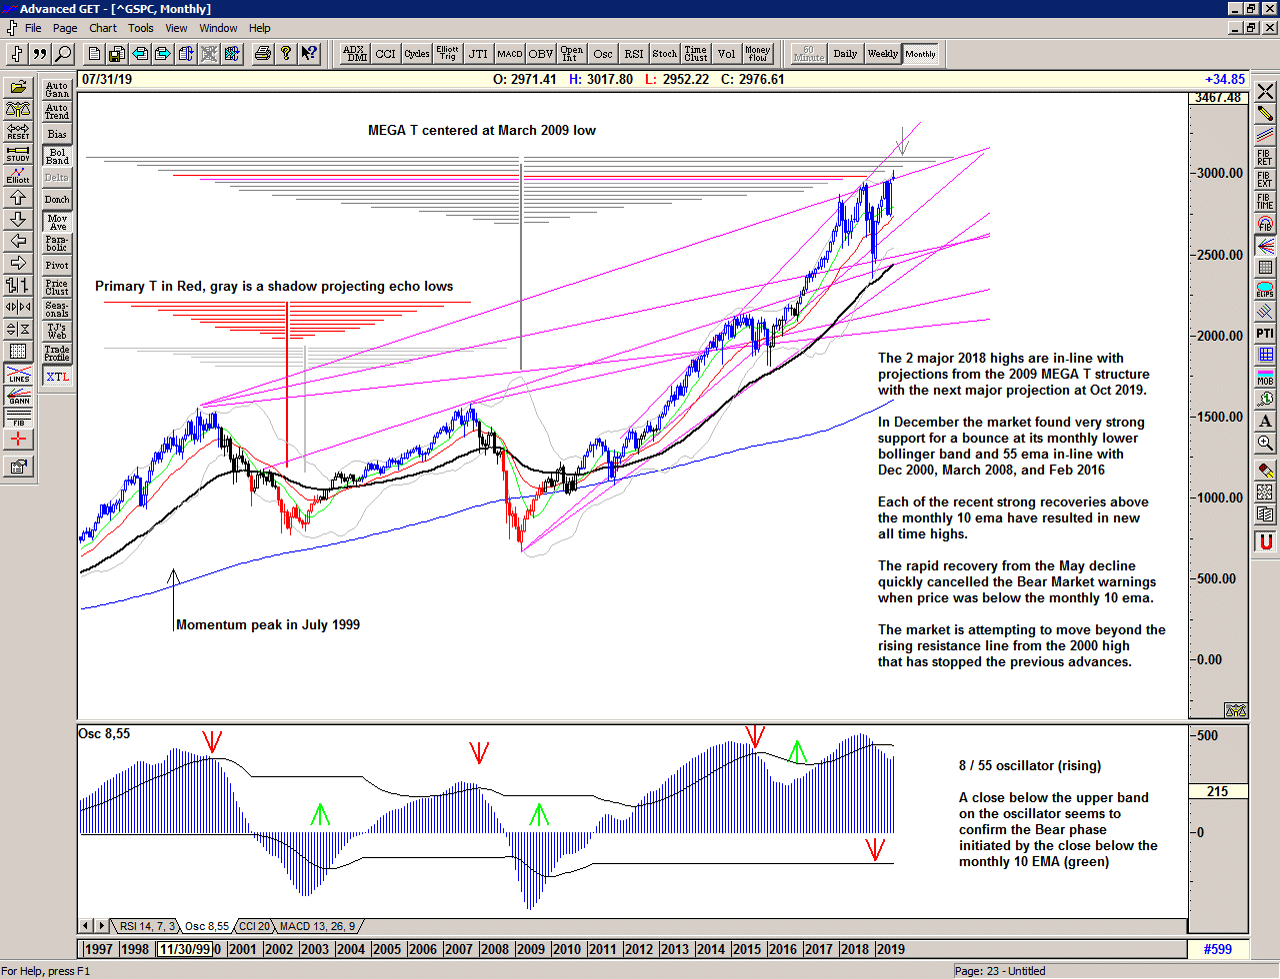
The monthly chart continues to show a bullish market attempting to push through the long term rising resistance from the major 2000 high and so far failing to do so, but once successful there is presumably significant upside.
There are some similarities in price action to the 2014-2016 period when the market processed the move up to and just beyond 2000 with the volatile choppy action that ultimately led to the relentless move higher in late 2017.
Save the image to your desktop to view a larger version
2019 continues to bring some fast and furious action in the market with a range that continues to be expansive. We can only assume that this will continue. This is a Brave New World.
–
Regardless of whether the market can continue higher or whether significant lows are ahead of us, the simplicity of the proprietary price based S/T Signalling System continues to keep us on the correct side of the market, with price currently pausing just below all time highs
If you would like to learn more about using the S/T Signalling System please get in touch.
–
Be prepared for whatever is coming next, and trade with confidence:
To receive detailed daily analysis, guidance and the updated daily Buy / Sell trigger levels being generated by the Trading the Line system before the market opens, and intraday alerts when appropriate, please become a Member and Sign up for Alerts & Observations – includes access to Members Area and the Explanatory Notes for all of the concepts discussed.
Disclaimer: This is the diary of a personal trading system, its methodology and the signals that it is producing. You are welcome to follow along but please understand that the information presented here is for educational purposes only. No recommendations are being made to buy, or sell stocks, options or futures contracts. Please consult your own financial advisor before making any investment decisions.