
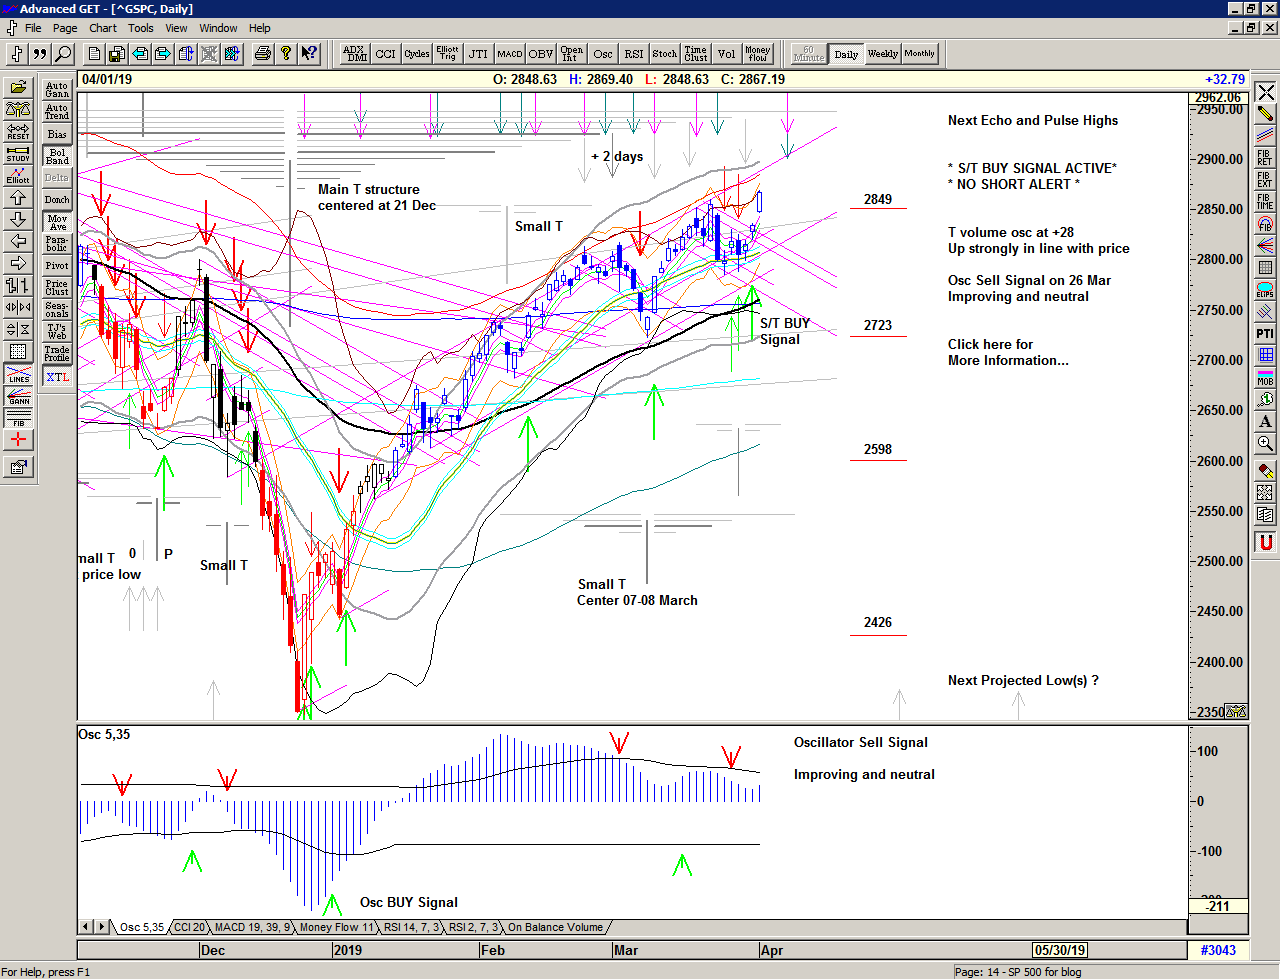
Another period of stabilization. This time at the important 2800 level as the market toyed with the idea of lower prices and fired off a series of disappointing signals with no follow through, before finally ejecting to the upside on the close of the quarter.
Political confusion and economic disappointment continue to be shrugged off as the market, in its now characteristic bump and jump chases higher, with catch up quick or get left behind fear of missing out in control.
So, another Buy Signal in motion and 2900 not that far away. What gives?
Save the image to your desktop to view a larger version
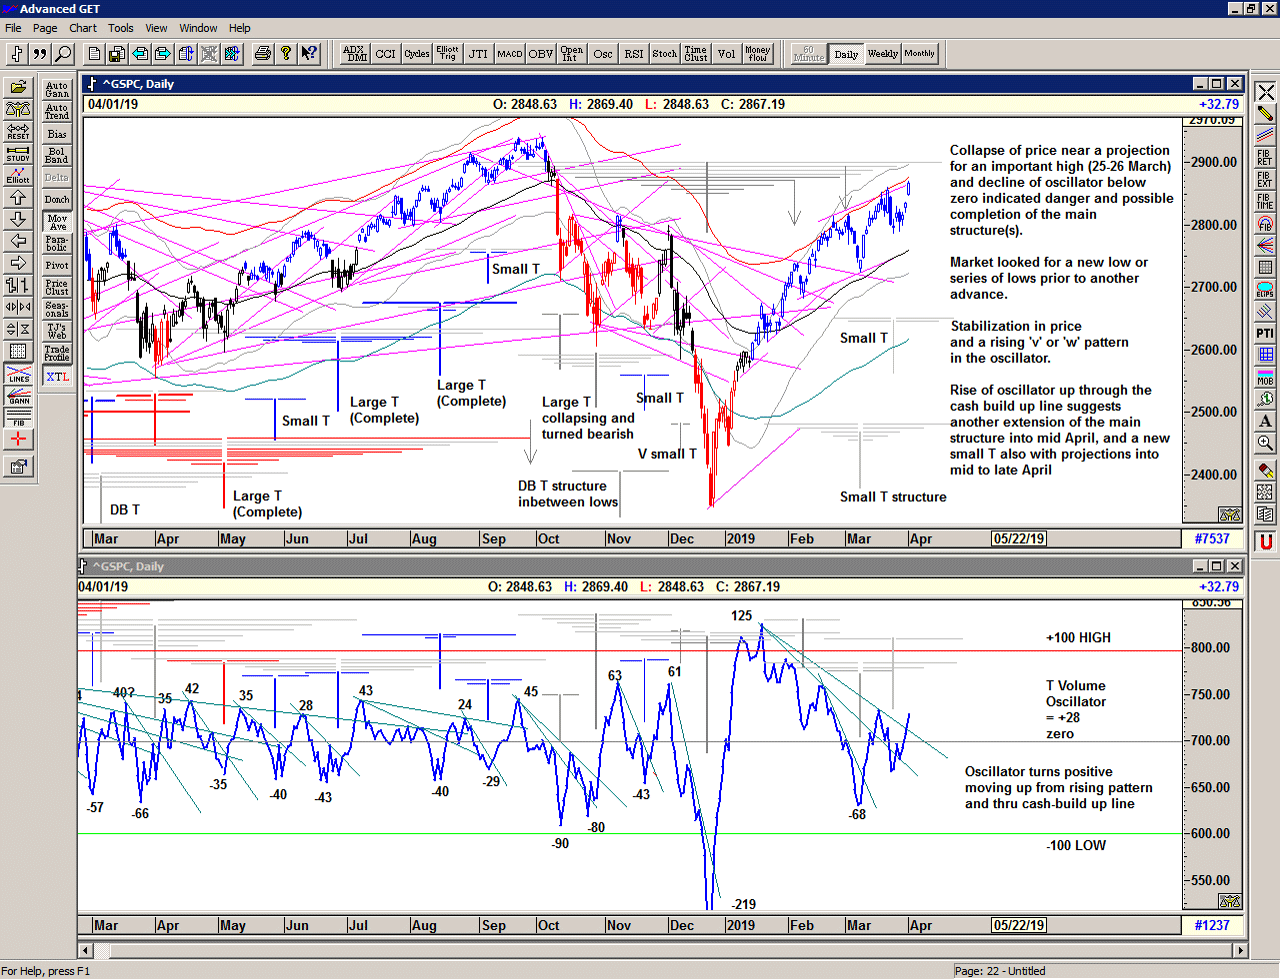
As we can see in the chart below, the T volume oscillator – an indication of Buying Power within the market as a whole – was declining into the late February / early March highs indicating relative weakness and profit-taking.
The bounce on 08 March led to another small T structure and another Buy Signal into the March highs.
We can see that the recent action has seen a rising oscillator pattern – the signature of a new T structure and a rise through the declining line of the oscillator – the long cash build up line.
If you need a reason to buy, this is a good one, as the stabilisation in the oscillator followed by a rise, indicates an increase in liquidity and buying power.
Save the image to your desktop to view a larger version
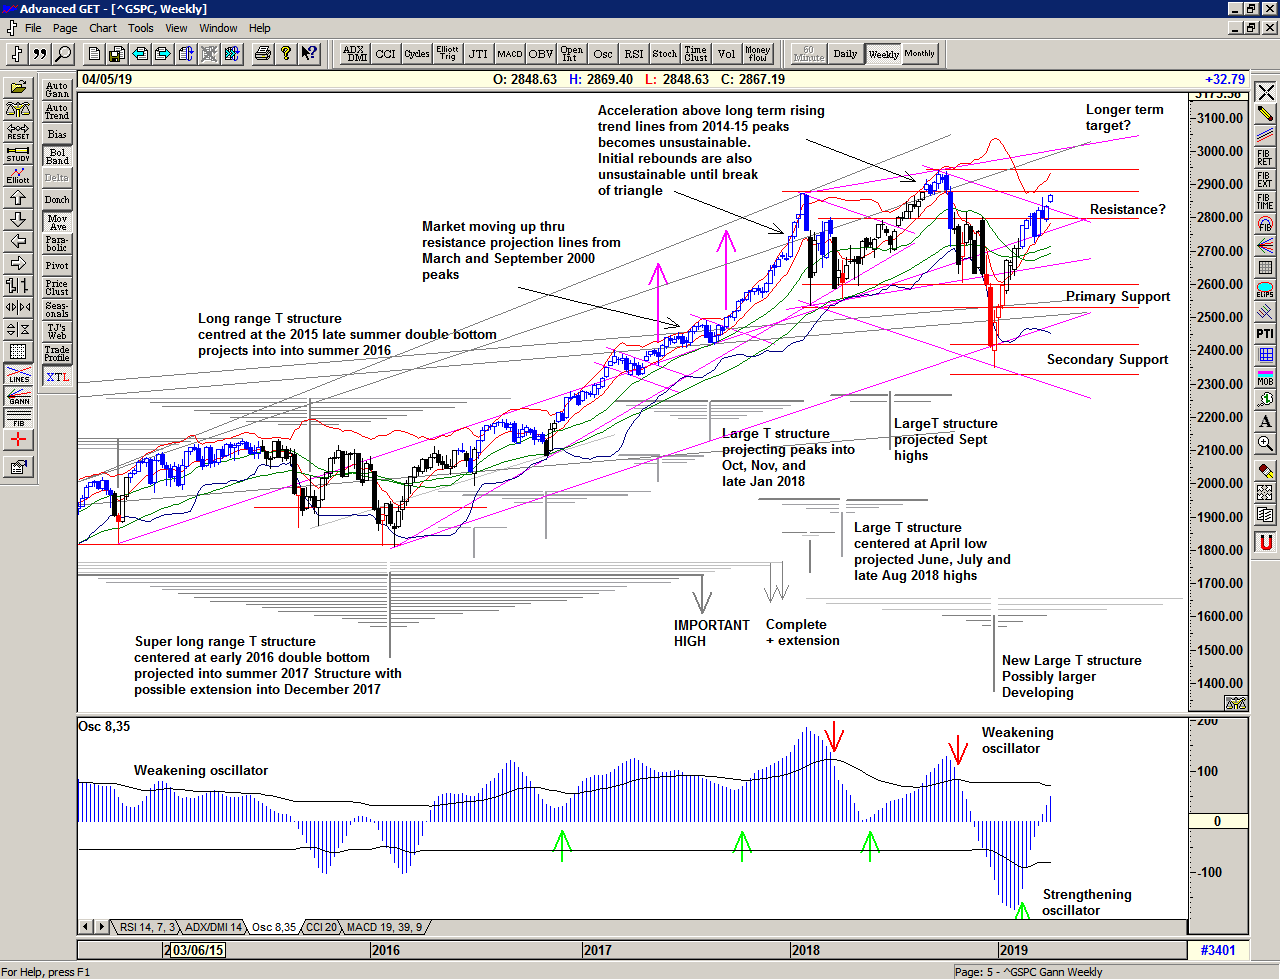
Zooming out to the weekly chart below. Having established a major support level (ie where exceptional value lies) at 2350, we can see that the market is now testing the strong resistance at and above 2800 where one might have expected a natural decline to occur.
Strength above here suggests a continuation of the very strong trend higher with the potential for new all time highs and a major long range T structure drawing power from all of the declines since the January 2018 high.
Save the image to your desktop to view a larger version
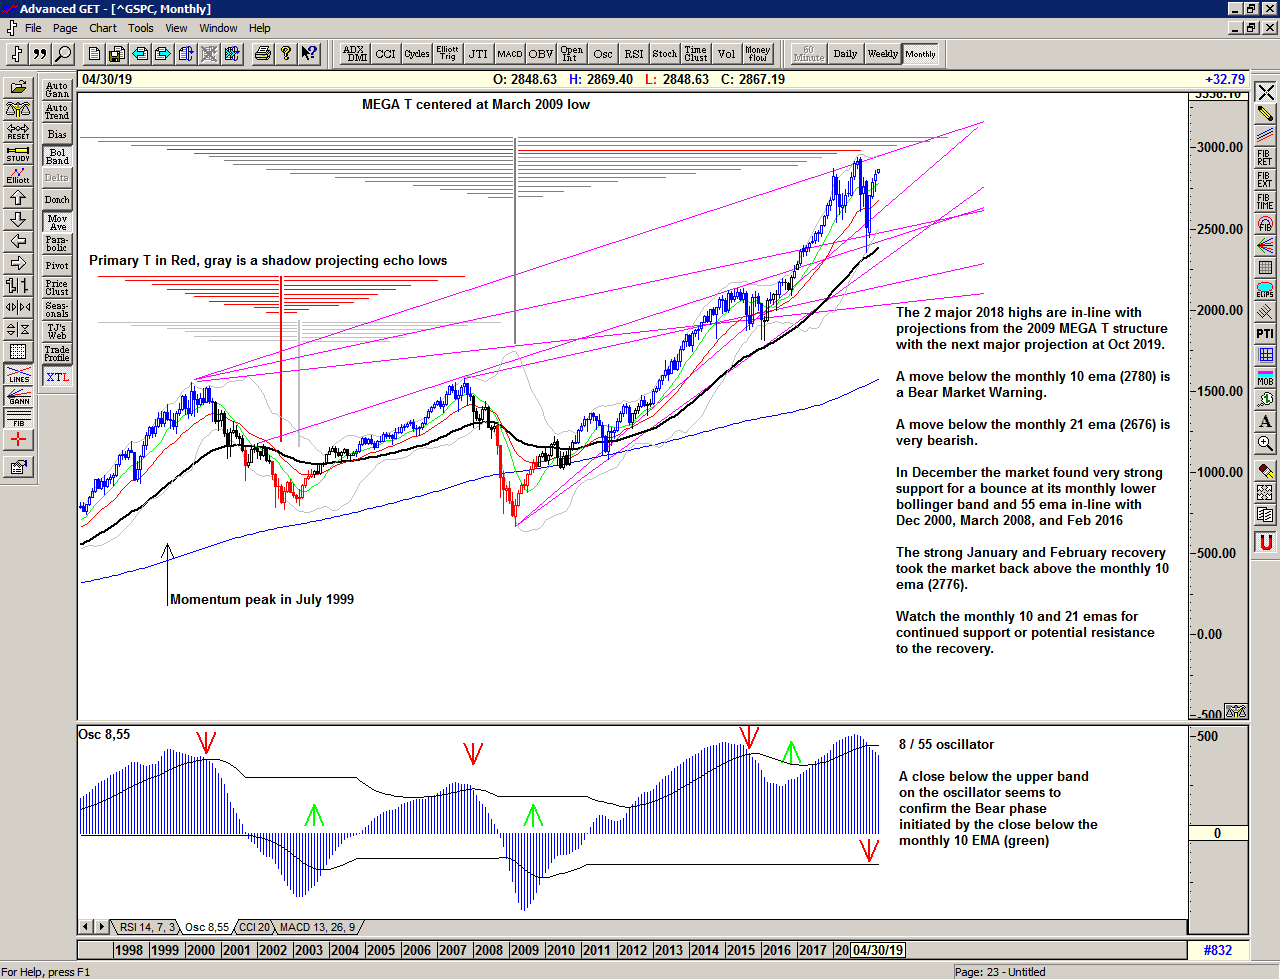
As we can see in the monthly chart the continued strong rise above the important monthly levels of 2676 (21 ema) and 2780 (10 ema) is very encouraging.
If the market is to continue to recover and proceed to new all time highs, as per the next very long range monthly projection for a high in the September – October time frame, we would like to see continued support at and above the monthly 10 ema.
The long range oscillator is still declining and potentially warning of trouble ahead but, for now, price is signalling otherwise, as it did in the recovery from the 2015 and 2016 lows.
Save the image to your desktop to view a larger version
All in all, 2019 has started with a move that continues the dynamic range of 2018 – far beyond the experience of the previous years. We should expect price volatility to continue and trade accordingly. This is a Brave New World.
–
Regardless of whether the market can continue to recover or whether deeper low(s) are ahead of us, the simplicity of the proprietary price based S/T Signalling System continues to keep us on the correct side of the market, providing another timely Buy Signal at the end of last week.
If you would like to learn more about using the S/T Signalling System please get in touch.
–
Be prepared for whatever is coming next, and trade with confidence:
To receive detailed daily analysis, guidance and the updated daily Buy / Sell trigger levels being generated by the Trading the Line system before the market opens, and intraday alerts when appropriate, please become a Member and Sign up for Alerts & Observations – includes access to Members Area and the Explanatory Notes for all of the concepts discussed.
Disclaimer: This is the diary of a personal trading system, its methodology and the signals that it is producing. You are welcome to follow along but please understand that the information presented here is for educational purposes only. No recommendations are being made to buy, or sell stocks, options or futures contracts. Please consult your own financial advisor before making any investment decisions.