
Brothers be ye constant.
The yoke which with single mind ye have taken, bear ye to the end;
and whatsoever ye have seen with me and heard, keep and fulfil.
Saint David, † 589
–
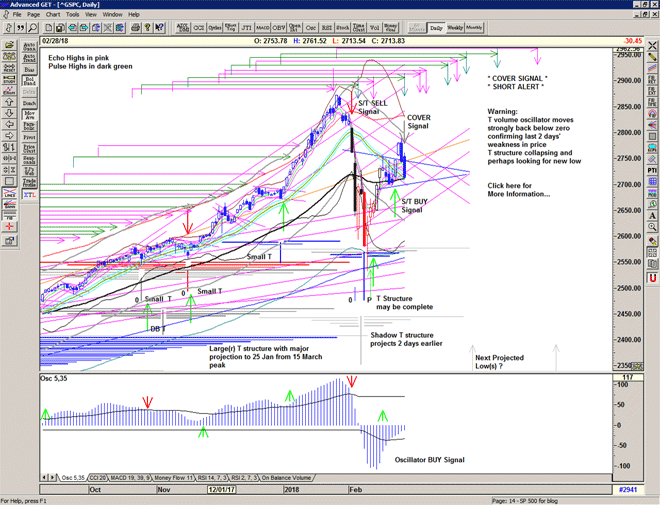
The market continues to sell into any strength and continues lower into the close with a Cover Signal triggered at 2734.
The T volume oscillator drops again significantly in-line with the selling and this now establishes 26 February as an important high, putting the new T under increased pressure and it may now be collapsing or complete. This now identifies 24 January as an important beginning of the decline from the all time high.
This of course now places the market back at what was important support for another test of strength.
IF the selling continues we will be looking for another low to combine with the previous one and form another T structure in due course.
IF the market recovers rapidly, we have additional projections for highs in early and late March.

Be prepared for whatever is coming next, and trade with confidence:
To receive detailed daily analysis, guidance and the updated daily Buy / Sell trigger levels being generated by the Trading the Line system before the market opens, and intraday alerts when appropriate, please become a Member and Sign up for Alerts & Observations – includes access to Members Area and the Explanatory Notes for all of the concepts discussed.
Disclaimer: This is the diary of a personal trading system, its methodology and the signals that it is producing. You are welcome to follow along but please understand that the information presented here is for educational purposes only. No recommendations are being made to buy, or sell stocks, options or futures contracts. Please consult your own financial advisor before making any investment decisions.