
Trouble in mind, I'm blue
But I won't be blue always,
'cause the sun's gonna shine
In my backdoor some day.
…
Well it's trouble, oh trouble
Trouble on my worried mind,
When you see me laughin'
I'm laughin' just to keep from cryin'.
Nina Simone, Trouble in Mind, 1960
–
Welcome to the Trading the Line Free Report.
Friday 23 March. No bounce above 2550, a move down to 2525, an attempt to recover to 2550, a relentless sell down into the close at 2588. A 2% drop in 2 hours. Relentless .
Is it the first stanza or the last stanza in Nina Simone's epic Trouble in Mind?
Firstly, we are in an area that bounces occur. At the lower extreme of the channel. At the 200 day moving average. At the location of the February bounce. Extremely oversold. So the market should bounce, shouldn't it?
Maybe, yes… BUT…
In 2 weeks the market has gone from 'Things are ok, recovery is back on', and the very bullish close on 09 March with a strong Buy Signal as mentioned in my last report… to 10 days of selling with several failed attempts at or near the Buy Signal level, erasing all of the gains since the February lows. The T structures have collapsed. We are looking for a new low, and this may not be it, not yet. Perhaps not by a long way
Something is wrong, and the market is attempting to evaluate just how big a problem that something actually is.
For now, the market is extemely dangerous and it is flashing a big red warning light.
It just might bounce, or it could easily sell down another 150 points (or more) this week.
For now the Sell Signal is active and the Buy Signal level is considerably higher.
So, let's take a look.
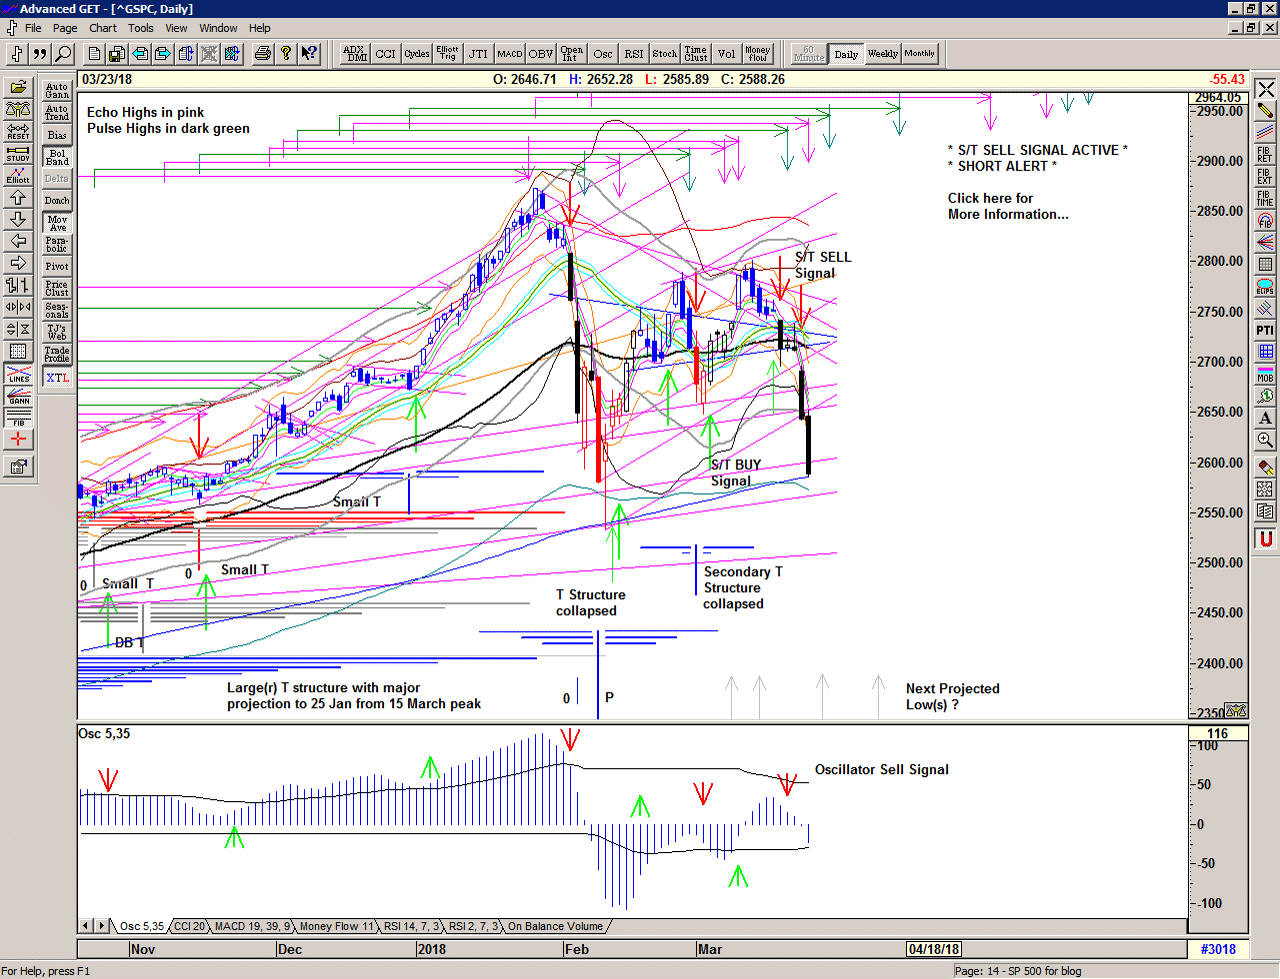
Save the image to your desktop to view a larger version
As you can see, the selling which started on 12 and 13 of March – with what now looks like a megaphone – took the market quickly down to the Mid-Channel resulting in a Sell Signal on 19 March and the OSc oscillator responded in turn making a momentum Sell Signal on 20 March.
The tentative recovery into the FED announcement on 21 March took the market just up towards the Buy Signal line and then the selling really started with avengeance.
Save the image to your desktop to view a larger version
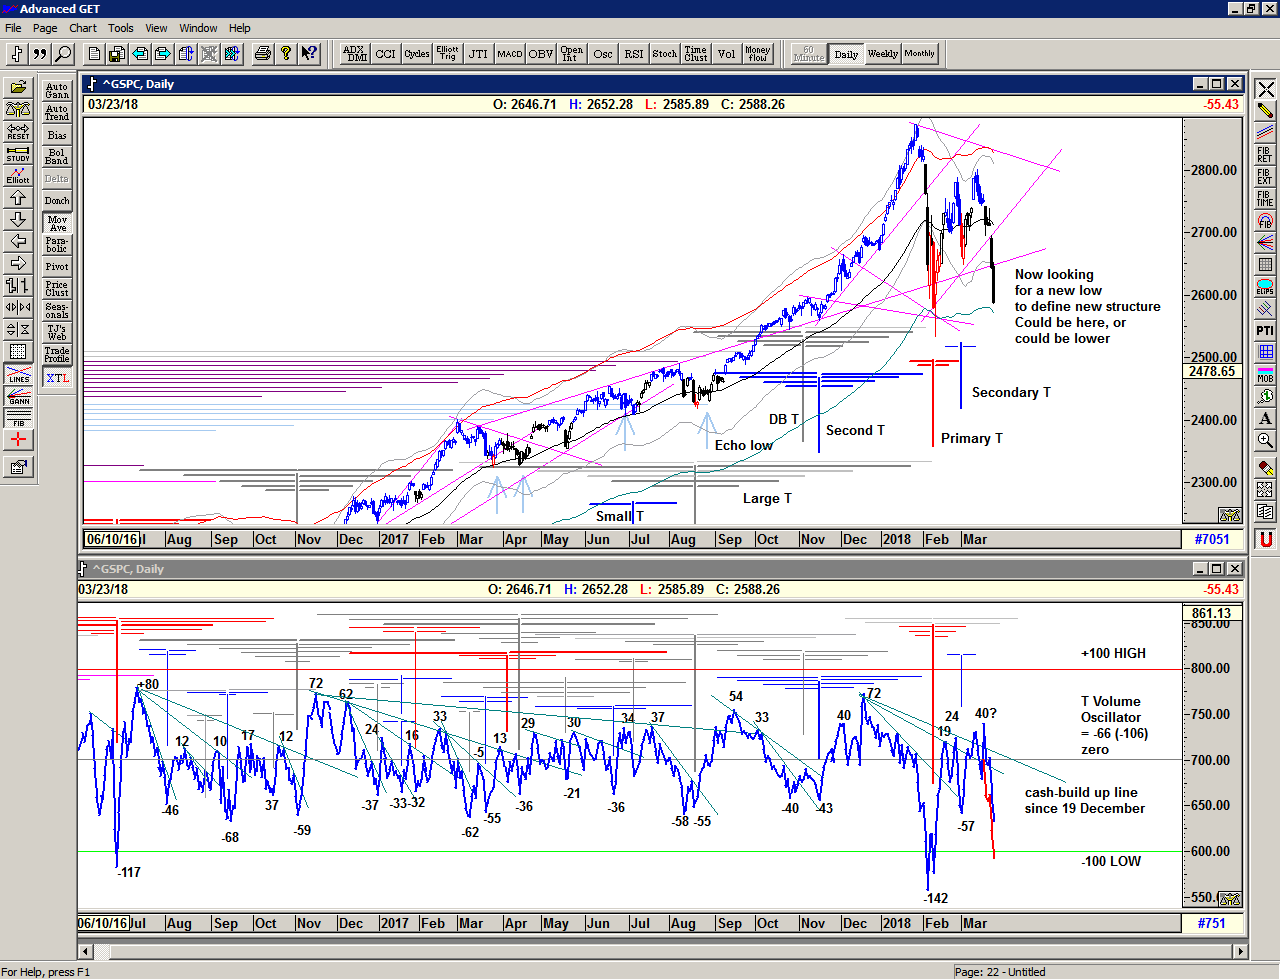
The T volume oscillator is moving rapidly lower in-line with the negative breadth. Unfortunately there was an anomaly on 16 March with a spike in the oscillator to +40 presumably caused by the expiration of a huge quantity of March put options and not due to underlining buying. The red line re-balances this and places the oscillator at least 40 points lower – in the region of the previous low.
The oscillator and price action indicate that the T structures have collapsed and we should now look for a new low to be established, for stabilisation to occur and for the oscillator to start rising, preferably with some kind of W pattern, prior to the next strong recovery.
Although that may occur here, we do not have any evidence yet.
Save the image to your desktop to view a larger version
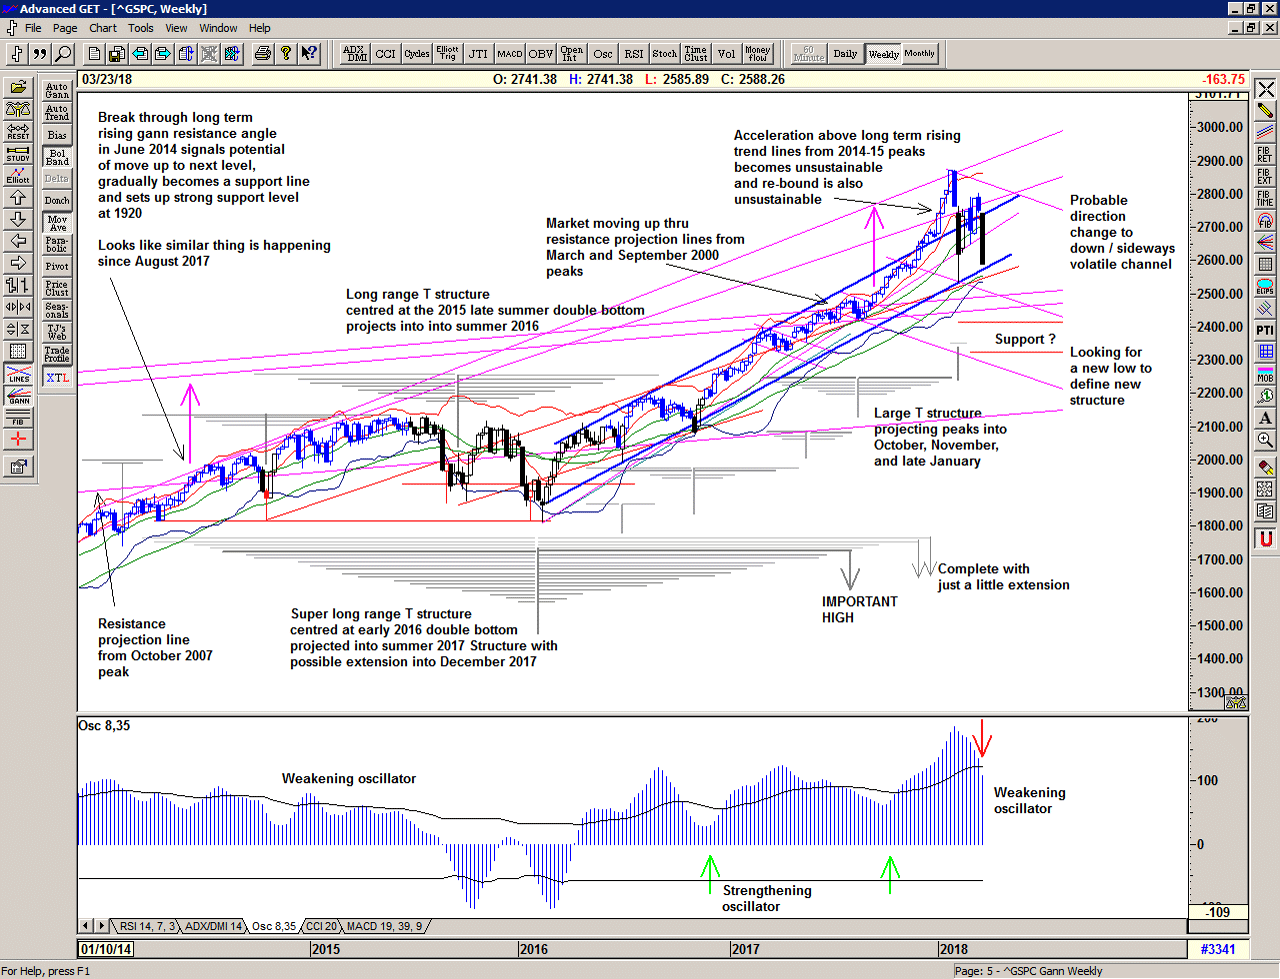
Zooming out to the weekly chart, we can see that price has dropped back to the bottom of the old channel – marked in blue and that it is certainly challenging this, as it now seems probable that the direction has changed to a downwards or sideways volatile channel.
For now, it would seem very likely that we shall see at least another test of 2530 – the February low – and if it does not hold it brings into focus the previous lows at 2420 and 2325. This is because price did not build very much support on the way up in the Fall. In effect what is happening when price makes a low is that price is establishing its value at that level.
This is interesting because we are seeing a challenge to the break-out above the resistance projection lines from the 2000 peaks. Observe how the market reacted to the break-out above the resistance projection line from the 2007 peak, ultimately rolling over and retracing back below into the 2015 and 2016 lows to establish a very long term platform for the move higher.
I suspect that over time we shall see a similar process and so the initial levels to keep an eye upon are 2530, 2420 and 2325.
2018 continues to bring with it some very exciting trading and a range that is far beyond the experience of recent years. We should expect it to continue and trade accordingly. This is a Brave New World.
–
In the meantime, the simplicity of my proprietary price based S/T Signalling System continues to keep us on the correct side of the market, providing a timely Sell signal and a red light, for now.
If you would like to learn more about using the S/T Signalling System please get in touch.
–
Be prepared for whatever is coming next, and trade with confidence:
To receive detailed daily analysis, guidance and the updated daily Buy / Sell trigger levels being generated by the Trading the Line system before the market opens, and intraday alerts when appropriate, please become a Member and Sign up for Alerts & Observations – includes access to Members Area and the Explanatory Notes for all of the concepts discussed.
Disclaimer: This is the diary of a personal trading system, its methodology and the signals that it is producing. You are welcome to follow along but please understand that the information presented here is for educational purposes only. No recommendations are being made to buy, or sell stocks, options or futures contracts. Please consult your own financial advisor before making any investment decisions.