
I've seen things you people wouldn't believe. Attack ships on fire off the shoulder of Orion. I watched C-beams glitter in the dark near the Tannhäuser Gate. All those moments will be lost in time, like tears in rain. Time to die.
– Bladerunner, 1982. Dir. Ridley Scott
Time for an update on the S&P 500.
With the market's recent visit to 2450 and some additional volatility entering the scene, the question arises: is it time for the market to rollover, and time to die?
Unfortunately the crystal ball is rather cloudy, but I think it is interesting to look at the various causes and effects, and weigh up the possibilities.
Each of the major lows has a T structure, and we can see that these structures drawn from previous highs to lows make projections in time that produce highs. The oscillator reveals the breadth or force of buying power behind the market's moves, and reveals some of the important turning points.
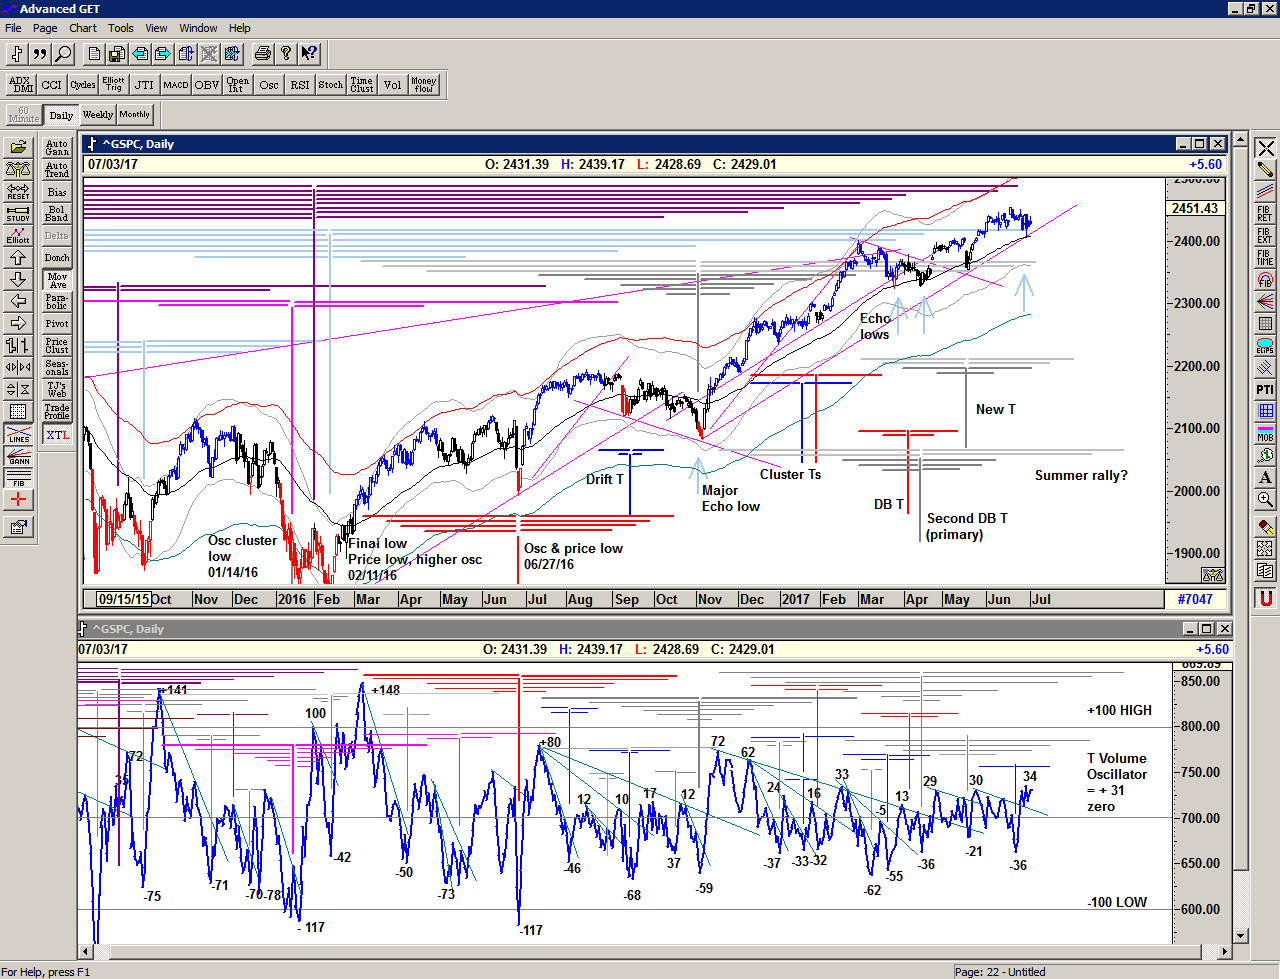
What we can see at the moment is that the very long range T structure (purple) associated with the January-February 2016 Double bottom is having a downward endgame effect. So too is the T structure associated with the Election low – I have drawn extensions of this structure back to the previous oscillator high (+148), and it looks like the most recent all time high coincides with this. And there may be another one in the next few days.
The pale blue structure associated with the second low of the major double bottom projects Echo lows, and interestingly this includes last week's visit to 2406, which occurred on an important rising line from the Election low, and at the important pivot line – the 55 exponential moving average.
The behaviour of the oscillator in recent months – breaking up through the descending cash-build up lines, albeit briefly – is still supportative of the 2 most recent T Structures with possible projections into August.
So – imminent collapse, or summer rally? Perhaps a bit of both. Violation of that important rising line and the 55 ema would most probably set up a short trip lower, where we most probably will find some renewed interest in pushing the market higher.
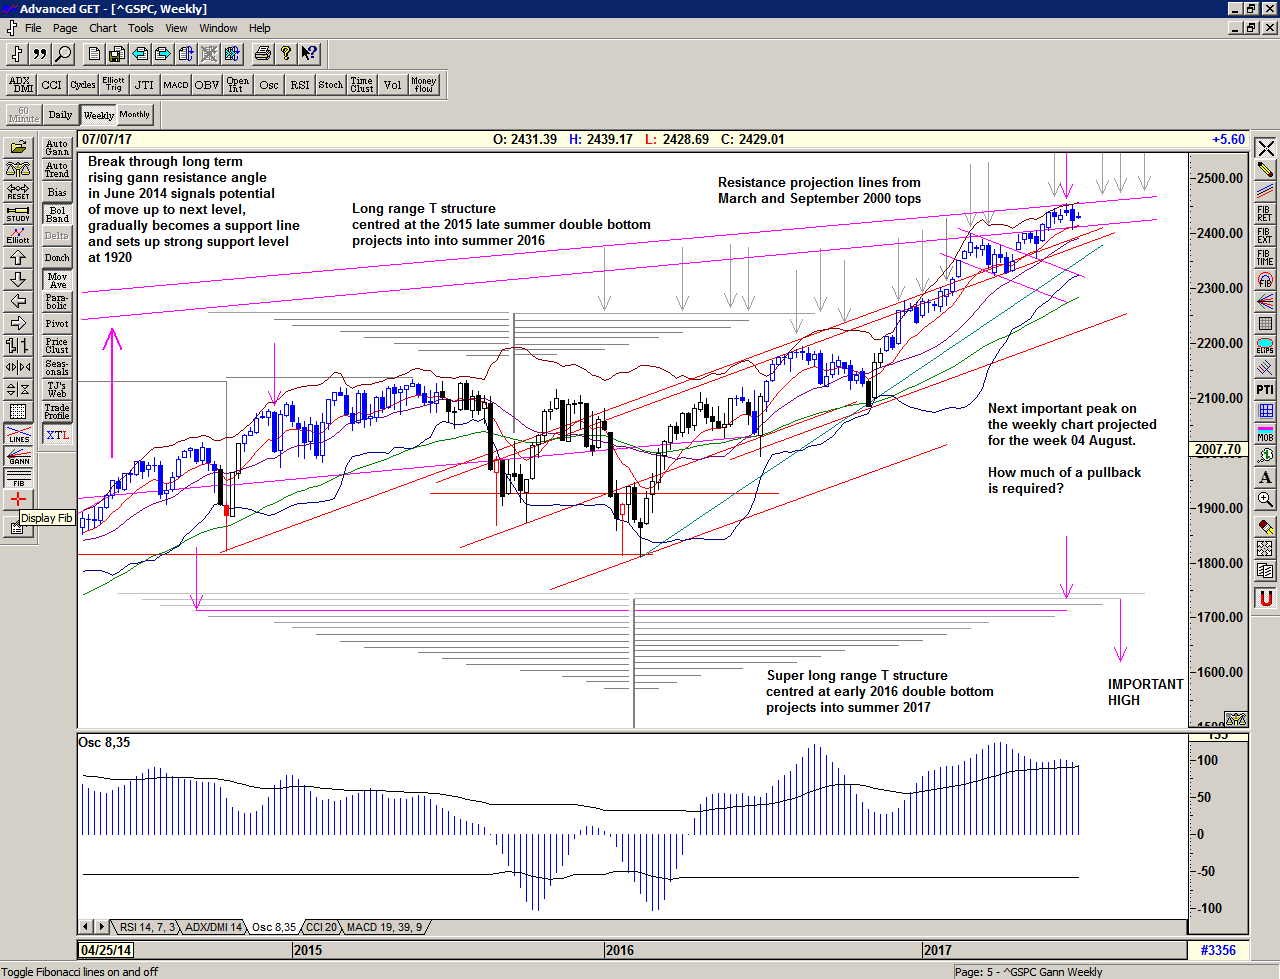
The weekly chart above shows the full potential range of the long range Double Bottom structure of early 2016. As you can see the market has been tackling the long term resistance lines that I have drawn from the March and September 2000 tops. I believe that when the market moves upwards through these lines it will set up a significant move higher. I suspect that it may be similar to the June 2014 breakthrough, which wasn't straight up but a process of re-testing the previous significant low and building a platform. Perhaps 2320-30 will become significant at future lows prior to the next major advance?
In the meantime it looks like the next important peak will be in the week of 4 August, with perhaps a more significant peak in the week of 25 August. How much of a pullback is required first, and whether to expect higher or lower highs is unclear, and is dependent upon what happens next.
Be prepared for what is coming next:
For more detailed ongoing analysis of the developments in the S&P500 index on a daily basis, as well as my personal Buy and Sell Signal trigger levels, please Sign up for daily Alerts & Observations. This includes access to the Members Area for an archive of all of my alerts and updates and my Explanatory Notes pdf which gives detailed explanations on all of the concepts being discussed.