
Time for an update on the S&P 500.
In my last report, I discussed the new T structure as the market popped up on the 'certainty' of the French Election and proceeded to attack the 2400 level. At that time it seemed likely that a pullback might occur due to the strong resistance at 2400 and the prescence of a large gap.
The one day sell-off last week closed that gap, price made a quick sell signal and headed for a long term rising trend line that originates at the Election low. That support line was never quite reached as the market headed straight back up to the highs generating a new Buy signal in the process, and a new small T.
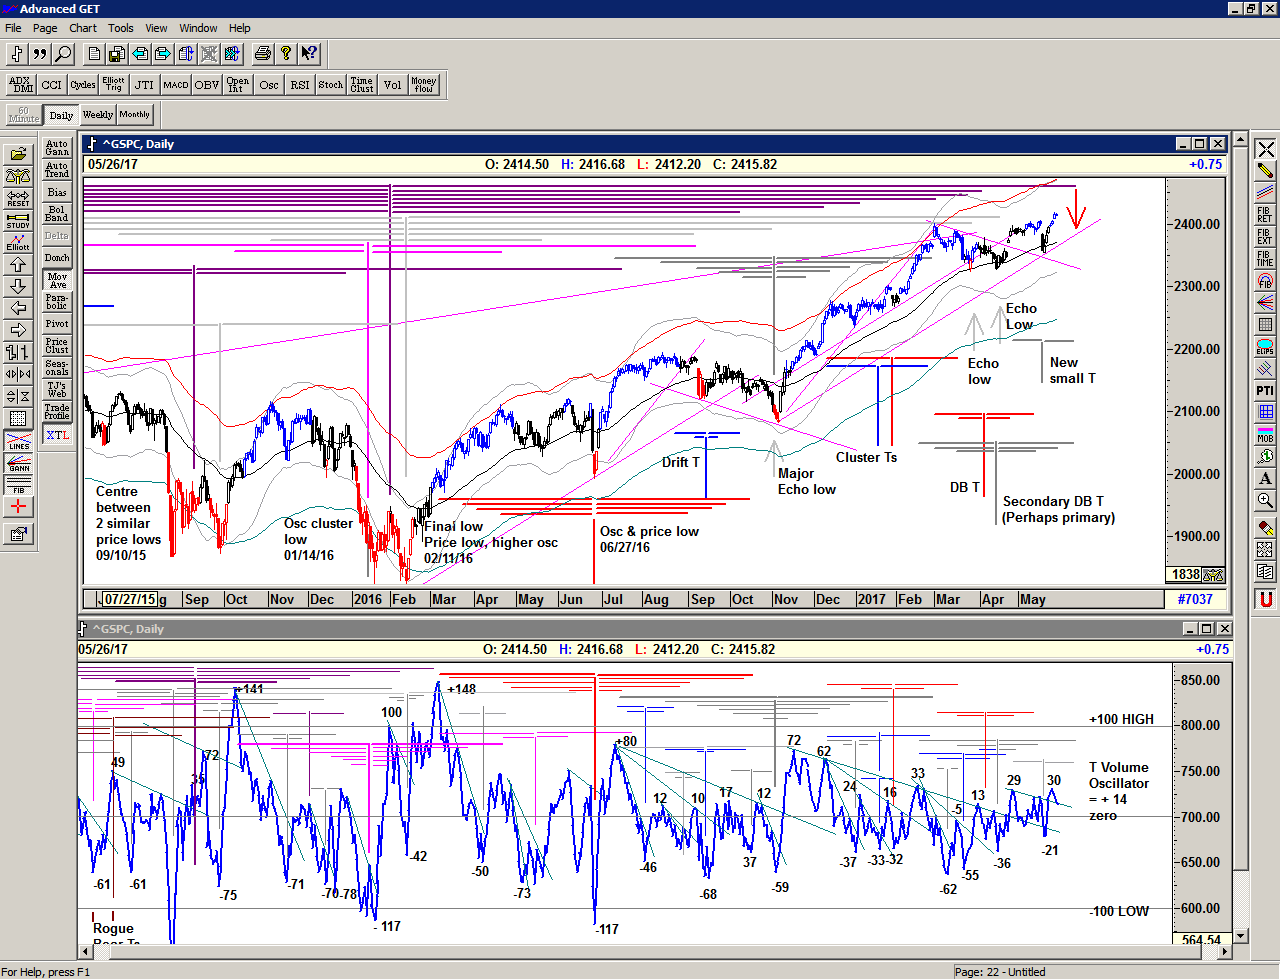
During this time I have also reflected upon the T structures that have been created in March and April due to the series of oscillator and price lows. It is complex – there are several higher lows in the oscillator lows and 2 similar price lows, followed by the recent higher low.
The first oscillator low & price of 9 March creates a very small simple T with the lower high.
The second oscillator low of 21 March which drops into the lower (opening) price low of 27 March sets up a collapsing T structure, and a shadow T structure centred on the price low.
The third oscillator & price low of 13 April sets up a double bottom, and this provides 2 possible T structures – a double bottom DB T structure centred inbetween the 2 lows and a second(ary) DB T structure centred on the final low.
The fourth oscillator & price low of 17 May creates a simple T projecting into 8 June.
Usually the Double bottom T structure would be more dominant and the secondary structure at the final low would project lows at its final arms rather than highs.
Interestingly the DB T structure and the Secondary DB T Structure have both recently produced highs at 9 and 15 May respectively, and this has led me to believe that the Secondary DB T Structure is actually the primary structure. This may be because the price low of 27 March was not a low that was sold into but rather that the market opened down significantly and rallied from that price.
And so the question arises, what's next?
Late last week we reached the end of a major arm of the Secondary DB T structure and the first arm of the new T structure, and so a pause or pullback here could be expected. However, both of these structures also project highs into the 6-9 June period.
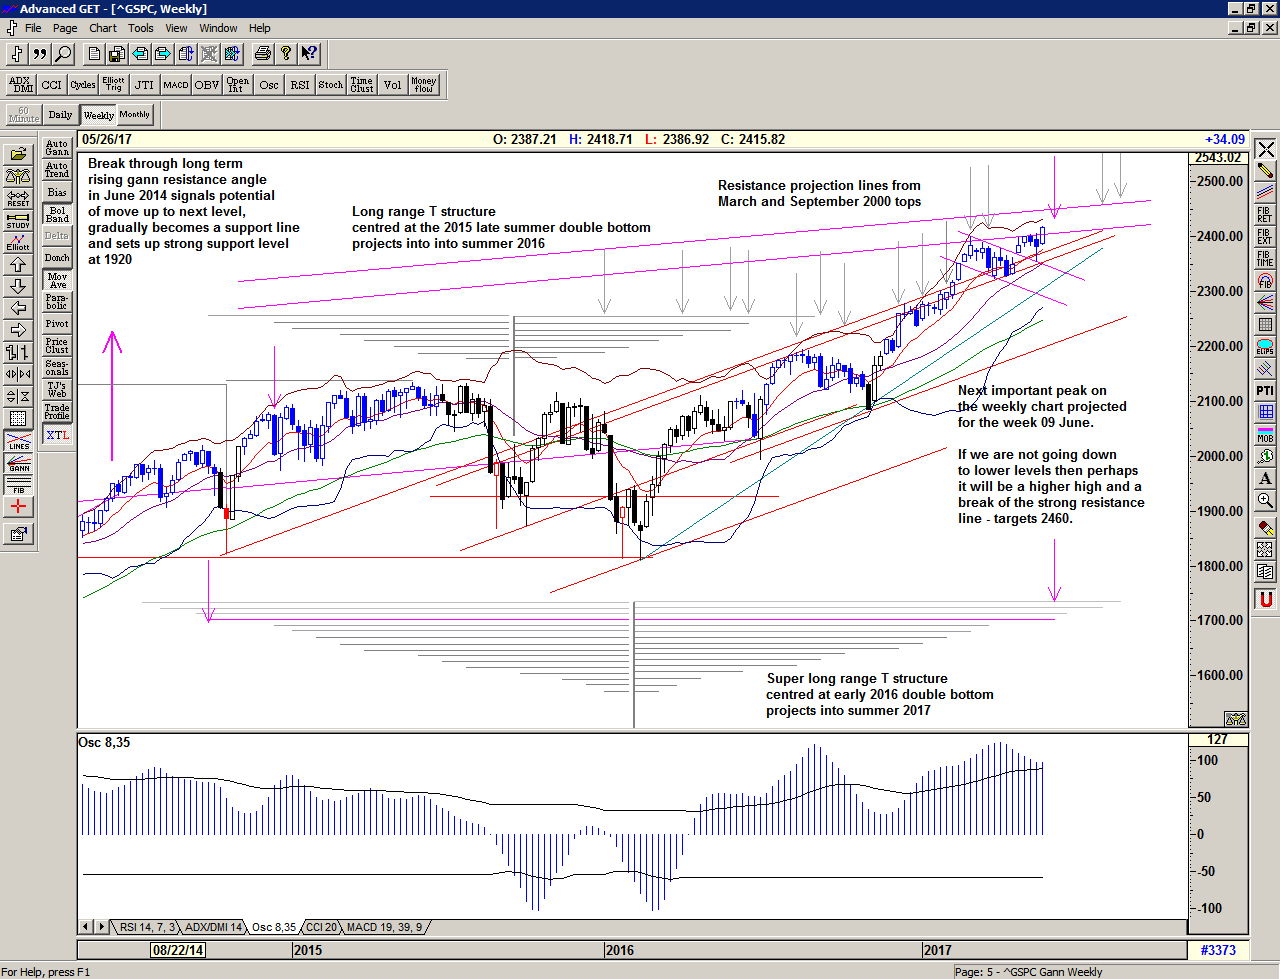
Looking at the super large T structure centred on the early 2016 double bottom we can see that there is the possibility of a high being projected from the 19 September 2014 peak – 342 days from high to low and back to high projects 8-9 June 2017. This is the purple arms at the top of the first chart.
Notice that the gray T structure drawn at the final low of that double bottom produces a series of Echo lows.
Be prepared for what is coming next:
For more detailed ongoing analysis of the developments in the S&P500 index on a daily basis, as well as my personal Buy and Sell Signal trigger levels, please Sign up for daily Alerts & Observations. This includes access to the Members Area for an archive of all of my alerts and updates and my Explanatory Notes pdf which gives detailed explanations on all of the concepts being discussed.